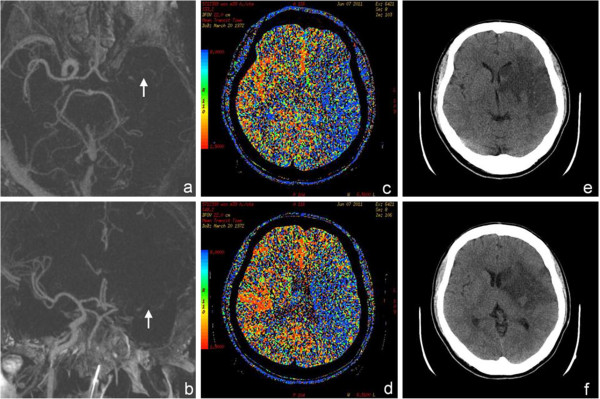
Figure 1.

CT imaging of the patient. (a, b) Reconstructed CT angiography revealed nearly total occlusion of left proximal middle cerebral artery (marked by the arrows). (c, d) CT perfusion study showed prolonged mean transit time (the blue area indicates the area of prolonged transit time) in most of the left cerebral hemisphere, which indicated reduced perfusion. (e, f) Follow-up non-contrast CT one day after the stroke showed a hypodensity in the left basal ganglia and peri-sylvian area, suggestive of a recent infarct. The size was much smaller than the previous perfusion defect.
