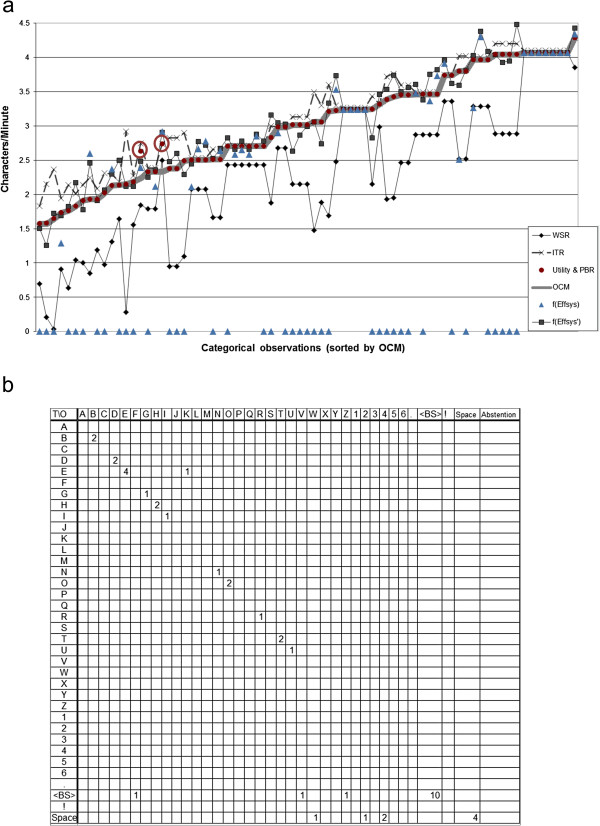
Figure 2.
Comparison of performance of Level 2 metrics. a) Comparison of each scalar Level 2 metric on data from a P300 copy-spelling task with correction, 75 sentences from 22 users, sorted by OCM. All metrics were converted into characters per minute (e.g. f(Effsys) and f(Effsys’) represent the metric multiplied by the character output rate). b) The ECM for the first observation presented in a), in a format required by checkerboard-style spellers. Note the sparsity of the matrix, even though data from fifteen minutes of BCI use are included. For practicality, the 74 ECMs corresponding to the other observations are not presented.

