Figure 3.

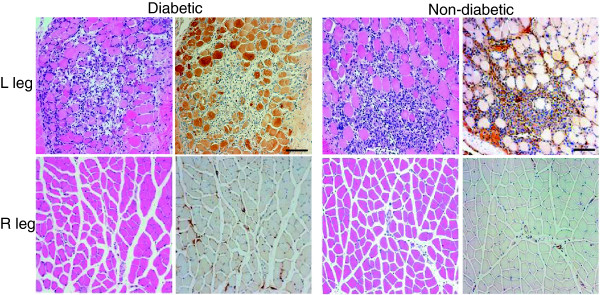
Histological findings. Serial sections from ischemic (L) diabetic and non-diabetic limbs. H&E staining is shown on the left and RAGE staining (brown) on the right for each set of images. Scale bar = 100 μm.

Histological findings. Serial sections from ischemic (L) diabetic and non-diabetic limbs. H&E staining is shown on the left and RAGE staining (brown) on the right for each set of images. Scale bar = 100 μm.