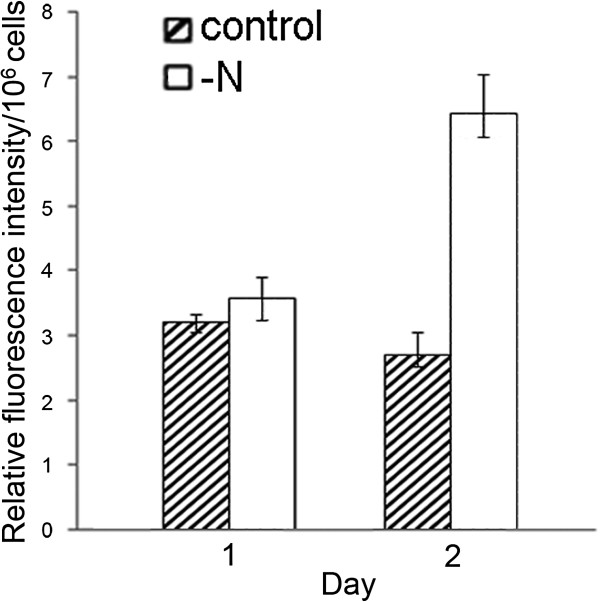
Figure 2.

Relative fluorescence intensity of diatom cells under N deprivation. Triplicate samples of diatom cells were stained with Nile Red after 1 and 2 days of N deprivation, their fluorescence was measured and their relative fluorescence intensity was calculated by subtracting the autofluorescence of non-stained microalgae and Nile red. The left and right columns in each day reprensent the control and –N, respectively.
