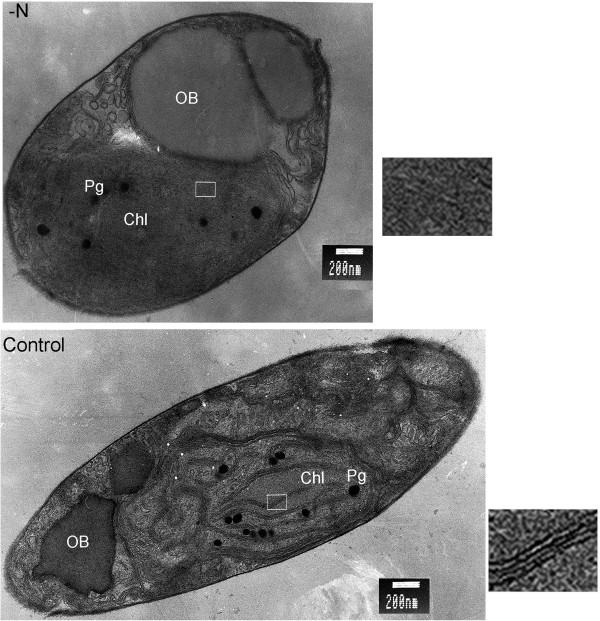
Figure 5.
Effects of N deprivation on P. tricornutum ultrastructure. Transmission electron micrographs showing subcellular structures of N-deprived (−N) and control P. tricornutum cells. OB, oil body; Chl, chloroplast; Pg, plastoglobule; boxed areas are magnified and showed to the right, demonstrating the dispersed thylakoid membranes under -N. Bar = 200 nm.

