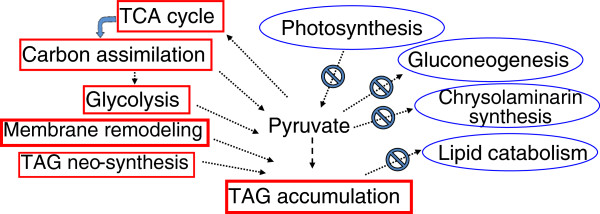
Figure 6.

Schematic diagram indicating effects of N deprivation on processes involved in TAG accumulation based on transcriptional changes. Square and elliptical boxes indicate up-regulation and down-regulation, respectively. “ѳ” indicates inhibition of the corresponding process.
