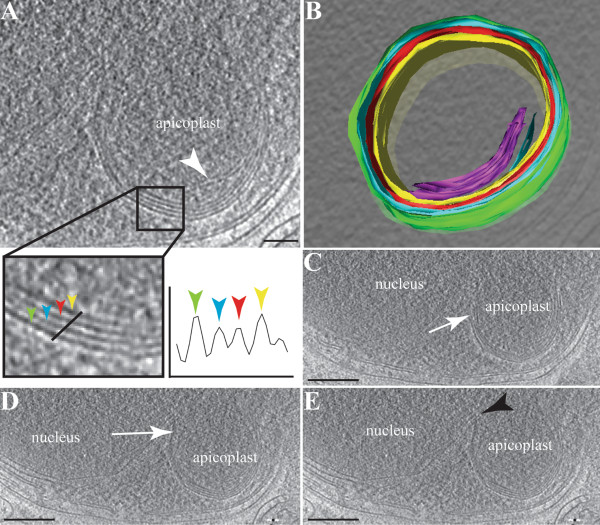
Figure 3.
Tomographic reconstruction of the apicoplast in a Plasmodium berghei merozoite. Panel A shows a virtual section of an apicoplast, with the four apicoplast membranes indicated by the coloured arrowheads and a graphed density distribution. The apicoplast matrix presents an internal membranous whorl as indicated (white arrowhead). Panel B shows a rendered model of the apicoplast, highlighting the internal whorls (purple) and the four membranes (yellow, red, blue and green). Panels C and D show sections where a gap is observed between membranes 2 and 3 (white arrows). In Panel E, a close apposition is observed between the nucleus and the apicoplast (black arrowhead). Scale bars: A = 60 nm; B-E = 20 nm.

