
Table 3.
Selected SAR related to the optimization of ML241.
 |
IC50 [μm]a | |||
|---|---|---|---|---|
| Compd | R1 | R2 | ATPase | UbG76V–GFP |
| ML241 | see Figure 3 | 0.11±0.03 | 3.5±0.4 | |
| 31 | 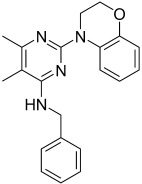 |
1.1±0.2 | 10±1 | |
| 32 |  |
2.9±0.2 | 27±3 | |
| 33 | OCH2CH2OH | benzyl | 0.17±0.05 | 3.8±0.8 |
| 34 | OCH2CH2OMe | benzyl | 0.6±0.03 | 6.5±0.7 |
| 35 | OCH2CH2NEt2 | benzyl | 0.4±0.08 | 5.3±0.6 |
| 36 | 4-methoxyphenyl | benzyl | 1.1±0.1 | 9±1 |
| 37 | n-butoxy | benzyl | 2.63±0.7 | 28±3 |
| 38 | methoxy | benzyl | 0.2±0.02 | 3.3±0.4 |
| 39 | OCH2CN | benzyl | 0.4±0.08 | 7.7±0.7 |
| 40 | methoxy | 4-fluorobenzyl | 1.9±0.4 | 3.7±0.6 |
| 41 | methoxy | thiophen-2-ylmethyl | 1.2±0.2 | 3±0.6 |
| 42 | methoxy | cyclohexylmethyl | 7.4±0.9 | 8.2±1 |
| 43 | methoxy | 2-hyrdoxylbenzyl | 4.6±1 | 6±0.6 |
a
Measurements were carried out in triplicate, and results are expressed as the mean ±SD.