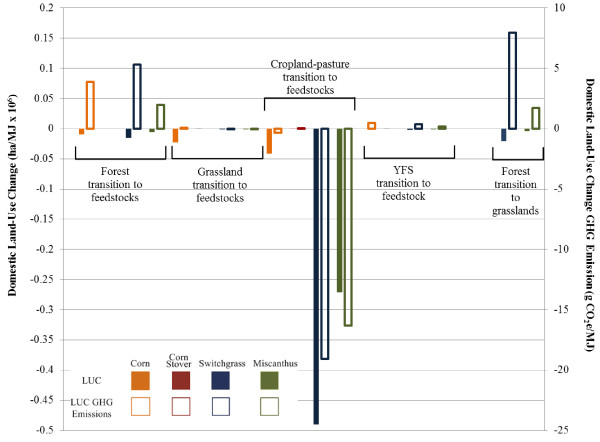
Figure 7.
LUC (ha/MJ × 106) and LUC GHG emissions (g CO2e/MJ) from selected land conversions. Legend: Solid and hollow bars represent LUC amounts and LUC GHG emissions, respectively. Orange, red, blue, and green bars indicate feedstocks of corn, corn stover, switchgrass, and miscanthus, respectively. Results reflect base case modelling conditions.

