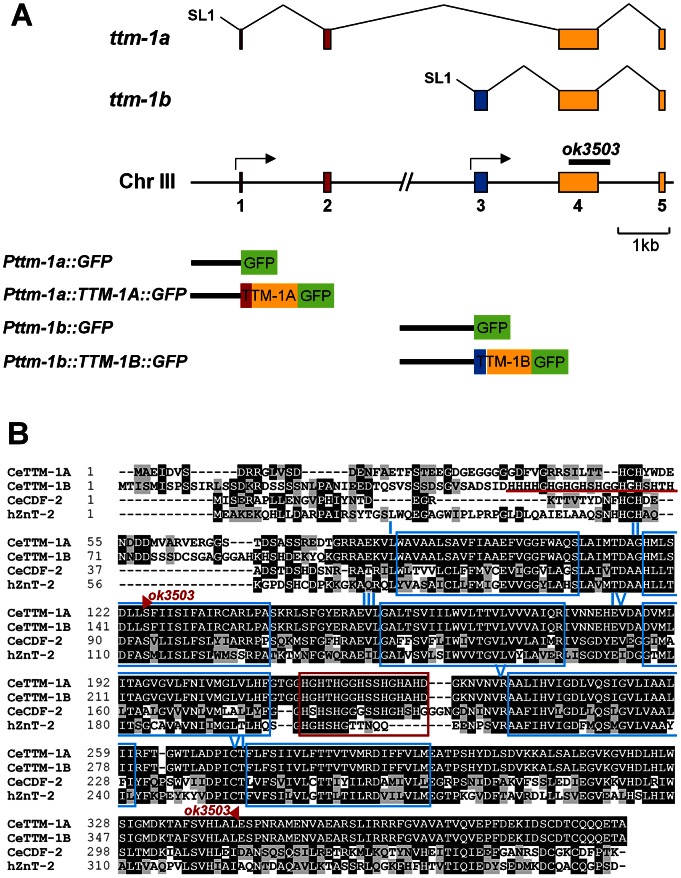
Figure 2. Structure of the ttm-1 gene and protein.
(A) The straight line indicates genomic DNA on chromosome III: numbered boxes indicate exons, and arrows indicate transcription start sites. The splicing patterns of ttm-1a and ttm-1b are shown above: Exons 1 and 2 (red) are unique to ttm-1a, exon 3 (blue) is unique to ttm-1b, and exons 4 and 5 (yellow) are common to both transcripts. SL1 indicates trans-spliced leader sequence. The black bar denotes the genomic region deleted in the ok3503 allele. Constructs used for expression pattern analysis are depicted below. Black lines denote promoter regions, and colored boxes denote protein coding sequences. (B) An alignment of the predicted TTM-1A and TTM-1B proteins with C. elegans CDF-2 and human ZnT2. Identical and similar amino acids are highlighted in black and gray, respectively. Blue boxes indicate the predicted six transmembrane motifs (labeled I–VI). The red box indicates the conserved histidine-rich motif, (HX)n, and the red bar indicates the additional histidine-rich motif in TTM-1B. Red triangles flank the amino acids encoded by the region deleted in the ok3503 allele.

