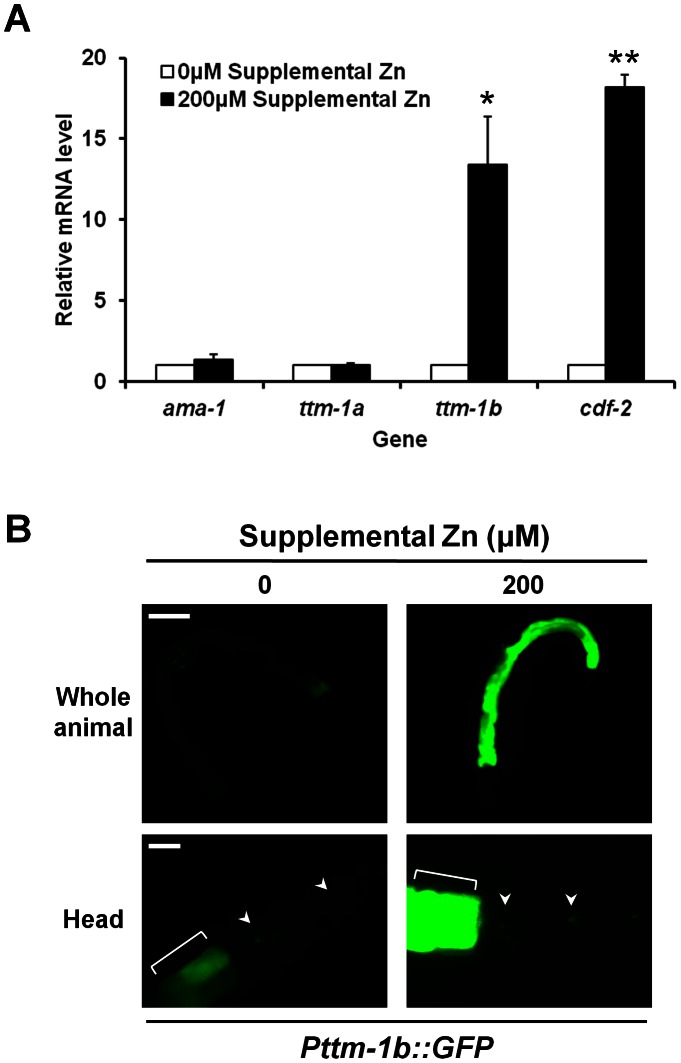
Figure 4. Regulation of ttm-1 expression by zinc.
(A) Wild-type animals were cultured with 0 µM or 200 µM supplemental zinc. RNA was extracted from a synchronized population at L4/adult stages, and mRNA levels of indicated genes were determined by quantitative real-time PCR. The Y-axis represents the fold changes of mRNA levels between 0 µM and 200 µM supplemental zinc, and the bars indicate the average ± SEM of three independent experiments. The mRNA levels at 0 µM supplemental zinc were set equal to 1.0 for each gene. ttm-1b was significantly induced by 200 µM compared to 0 µM supplemental zinc (*p<0.05), similar to the positive control gene cdf-2 (**p<0.01) [28], [30]. ttm-1a was not responsive to zinc, similar to the negative control gene ama-1 [28], [30]. (B) Fluorescence microscope images of Pttm-1b::GFP transgenic animals cultured with 0 µM or 200 µM supplemental zinc. Whole animals are shown in the top panels, and the head and anterior most intestinal cells are shown in the bottom panels (anterior to the right). While GFP expression was induced in intestinal cells by 200 µM supplemental zinc (top panel and brackets in lower panel), GFP expression was not induced in the head neurons (arrow heads). Images in each panel were captured with the identical settings and exposure times. Scale bars represent 100 µm (top) and 20 µm (bottom).

