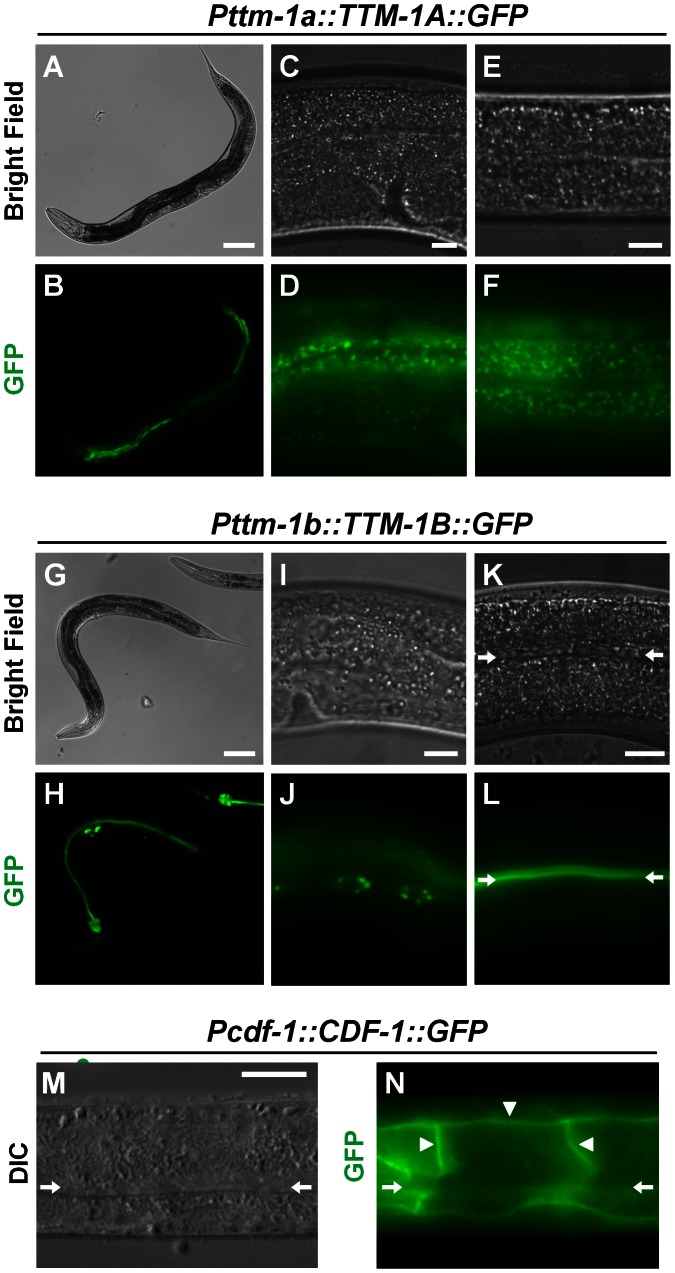
Figure 5. Intracellular localization of TTM-1 isoforms and CDF-1.
Bright field and fluorescence microscope images of live transgenic animals expressing TTM-1A::GFP [Pttm-1a::TTM-1A::GFP] (A–F) or TTM-1B::GFP [Pttm-1b::TTM-1B::GFP] (G–L). Differential interference contrast (DIC) and fluorescence microscope images of a fixed transgenic animal expressing CDF-1::GFP [Pcdf-1::CDF-1::GFP] that was immunostained with an anti-GFP antibody (M–N). Bright field and DIC show morphology, and green displays GFP. Images show an entire animal (A–B, G–H), intestinal cells (C–D, K–L, M–N), hypodermal cells (E–F), and seam cells (I–J). The arrows indicate the lumen of the intestine (K–N). TTM-1A::GFP displayed diffuse, punctuate staining in intestinal and hypodermal cells. TTM-1B::GFP displayed punctuate staining in seam cells and was localized to the apical plasma membrane of intestinal cells. The diffuse fluorescence signal in panel J derives from GFP that is out of the focal plane. CDF-1::GFP was localized to the basolaternal plasma membrane of intestinal cells (triangles). Scale bars represent 100 µm (A, G) and 10 µm (C, E, I, K, M).

