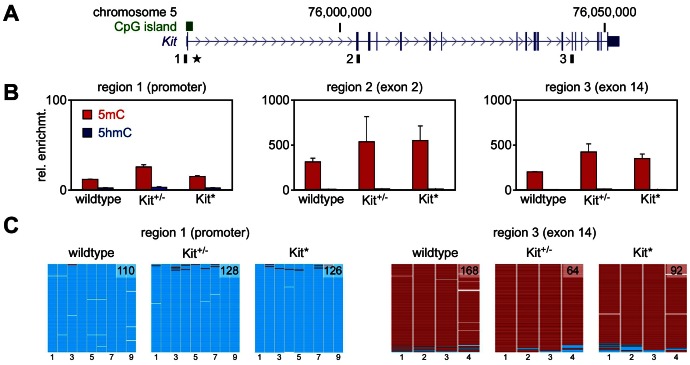
Figure 2. DNA methylation analysis.
A. Structure of the Kit transcription unit on mouse chromosome 5. Regions analyzed by (h)meDIP are indicated as black boxes, the promoter-associated CpG island is shown as a green box and the transgene insertion site of the KittmlAlf1/+ allele is marked by an asterisk. B. (h)meDIP analysis of genomic DNA from mouse testes. Immunoprecipitated DNA was amplified by locus-specific qPCR and enrichments were calculated relative to the unmethylated actin control. 5mC values are shown as red bars and 5hmC values as blue bars. Diagrams show the results of at least three independent experiments, standard errors of the mean are indicated by error bars. C. Bisulfite sequencing analysis of genomic DNA from testes. Methylation maps show 454 sequencing reads (rows) and the methylation status of 9 CpGs (columns) within the Kit promoter and 4 CpGs from the Kit exon 14 region. Methylated CpGs are shown in red, unmethylated CpGs in cyan and gaps in white. Numbers in methylation maps indicate the number of sequencing reads.

