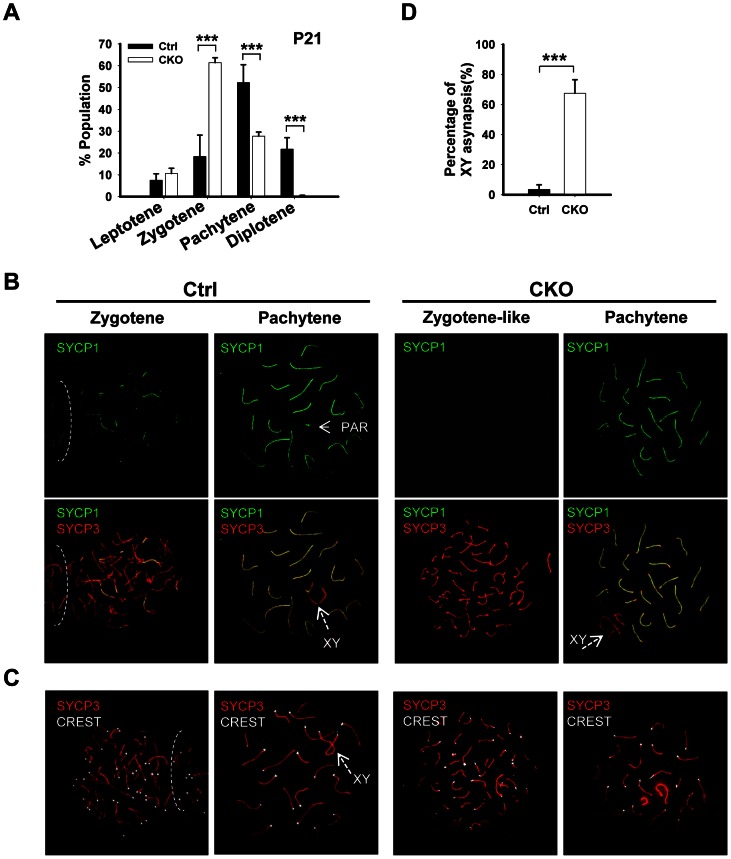
Figure 3. Ikbkap mutant spermatocytes exhibit synapsis defects.
(A) Bar graph representation of the percentage of the spermatocytes in each meiotic prophase stages of the control and CKO mice. A total of around 170 cells per testis were counted. (***) P<0.001. (B) Representative images of chromosome spreads from control and CKO spermatocytes co-stained with SYCP1 (green) and SYCP3 (red) antibodies. (C) Representative images of chromosome spreads from control and CKO spermatocytes stained with SYCP3 (red) and CREST (white) antibodies. (D) The percentage of unsynapsed X and Y chromosomes in the pachytene spermatocytes. (***) P<0.001.

