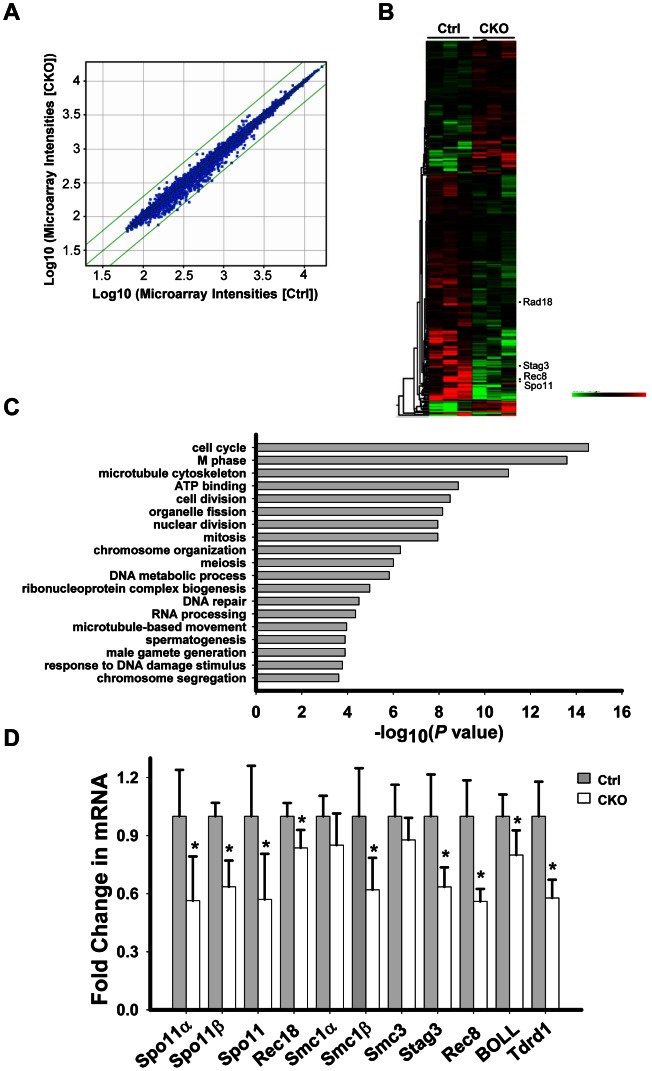
Figure 5. Ikbkap deletion results in transcriptional alteration.
(A) Scatter plot of the microarray data in control and CKO testes at P15. Green lines represent differences of 2-fold from the center line. The plot is on the log scale. (B) Heatmap illustration of the genes with significantly changed (P<0.05). (C) Gene ontology (GO) analysis for the significantly changed genes identified in (A). A representative selection of significant GO categories is shown. (D) RT-qPCR verification of the selected genes using RNAs isolated from P15 control and CKO testes. N = 4. (*) P<0.01.

