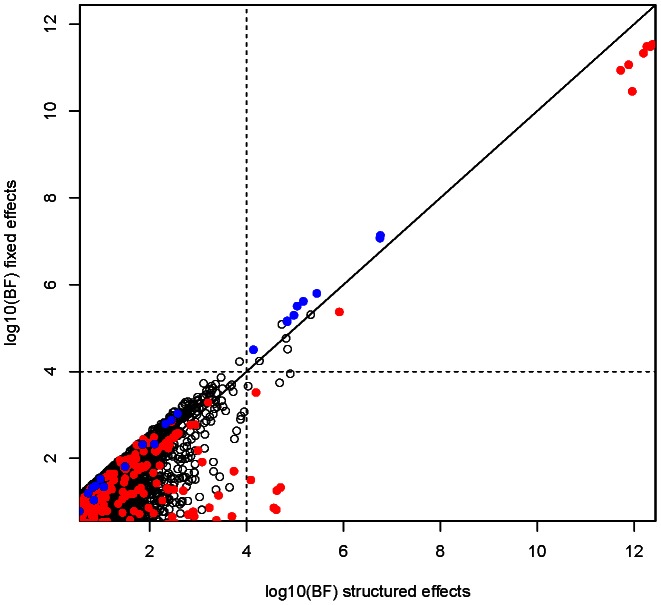
Figure 4. Comparison of fixed and structure effect Bayes factor at autosomal SNPs.
Red dots indicate SNPs mapping to the HBB region in and blue dots indicate those mapping to the ABO region (see Figure 3). Note that points below the diagonal line have more evidence for association under a structured effects model, whereas those above the line have more evidence for association under a fixed effect model.

