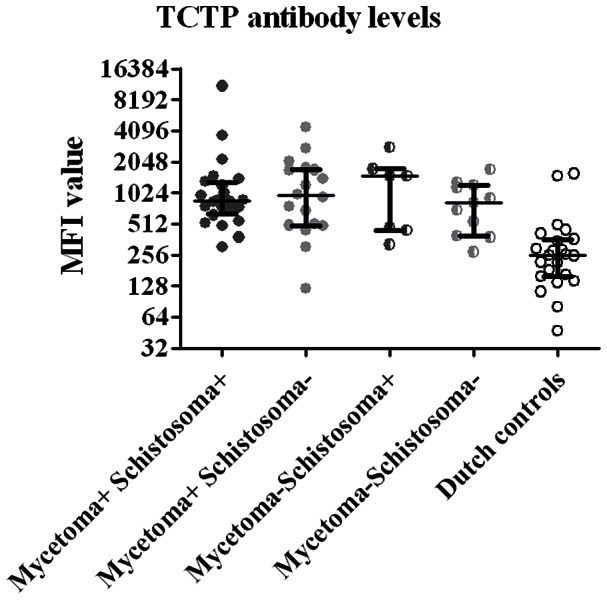
Figure 3. Median fluorescence intensity of Madurella mycetomatis TCTP in various groups.

Median fluorescence intensity (MFI) values reflecting levels of antigen-specific IgG for recombinant Madurella mycetomatis his-tagged TCTP in eumycetoma patients with positive Schistosoma-serology (mycetoma+ Schistosoma+), eumycetoma patients without positive Schistosoma-serology (mycetoma+ Schistosoma−), healthy endemic controls with positive Schistosoma-serology (mycetoma− Schistosoma+), healthy endemic controls without positive Schistosoma-serology (mycetoma− Schistosoma−) and Dutch controls. Each symbol represents a single patient or control. Horizontal Lines indicate median levels of anti-Madurella antibodies. Significance was calculated with the Mann-Whitney test. Only antibody levels measured in Dutch controls were significantly lower than any other group (all p<0.01).
