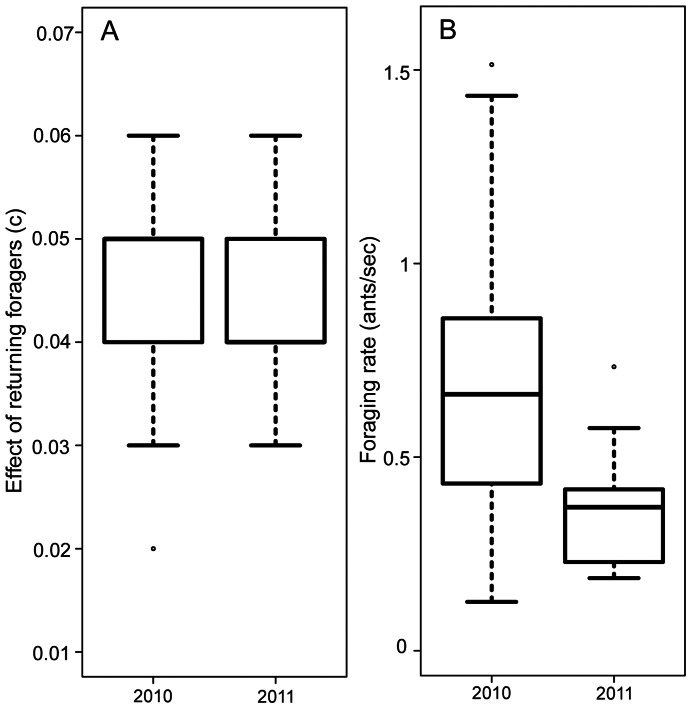
Figure 2. Differences between 2010 and 2011 for 5 colonies.
A. The effect of returning foragers on the rate of outgoing foragers (c). B. Foraging rate. Boxes indicate the lower and upper quartiles; horizontal lines within boxes indicate the median, whiskers extend to 1.5 interquartile range from the box, and points indicate outliers.

