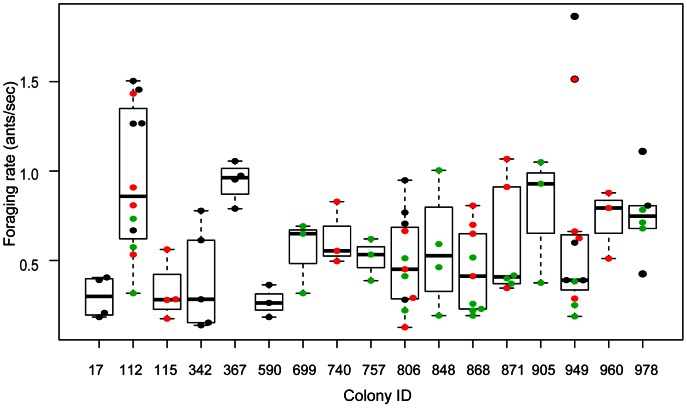
Figure 3. Variation among colonies in foraging rate.
Numbers on the x-axis are the colony IDs. Boxes indicate the lower and upper quartiles; horizontal lines within boxes indicate the median, whiskers extend to 1.5 interquartile range from the box. Points represent the values of foraging rate for each trial. Black dots are for trials conducted in 2009, red dots for 2010, and green dots for 2011. Overlapping points are slightly offset along the x axis.

