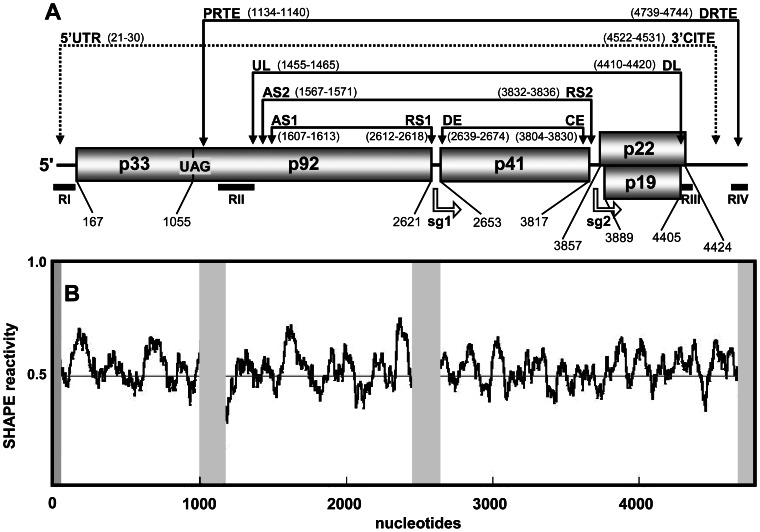
Figure 1. TBSV RNA genome structure.
(A) Linear representation of the TBSV plus-strand RNA genome. Encoded proteins are shown as boxes with molecular masses (in thousands). The genomic coordinates for the start and stop codons for each encoded protein are shown below the genome. Also shown below are the relative locations of the initiation sites for transcription for sg mRNAs (represented as open arrows and labeled sg1 and sg2), as well as regions (RI through RIV) that are present in prototypical TBSV defective interfering (DI) RNAs (shown as horizontal black bars). The relative locations of intra-genomic long-range RNA-RNA interactions are shown by the labeled double-headed arrows above the genome. Each double-headed arrow connects a complementary cognate sequence pair identified by their acronyms. The coordinates for complementary segments are provided in parentheses. See text for details. (B) Median SHAPE reactivities along the TBSV RNA genome based on a 75 nt long moving window. The overall average SHAPE reactivity value was 0.488 and is represented in the graph as a red line. Grey shading indicates regions for which no SHAPE reactivity was recovered.

