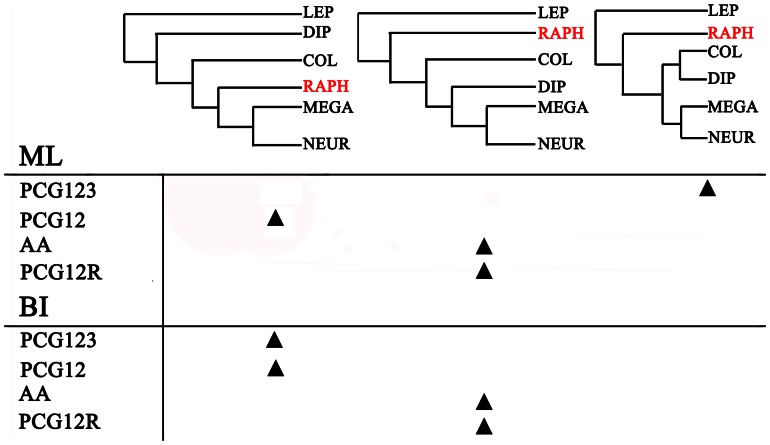
Figure 6. Interordinal relationships inferred by different datasets and analytical methods.
The triangle indicates that the most likely tree recovered for a particular dataset/analysis combination supports one of the three topologies listed. COL: Coleoptera, DIP: Diptera; LEP: Lepidoptera; MEGA: Megaloptera; NEUR: Neuroptera; RAPH: Raphidioptera.

