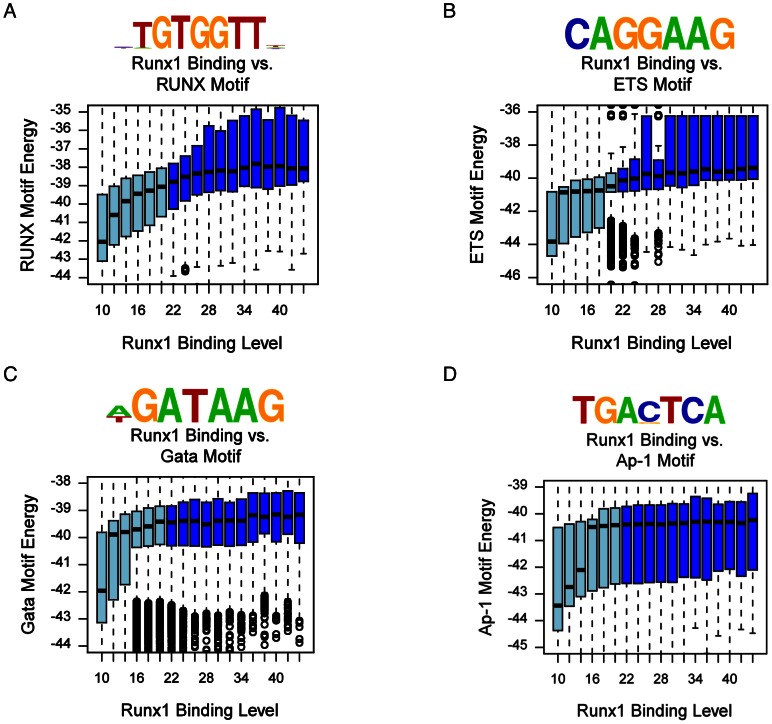
Figure 5. Enrichment of TF motifs in Runx1 bound genomic regions.
(A) RUNX motif binding energy is correlated with RUNX1 ChIP-seq occupancy. The indicated RUNX motif was inferred directly from Runx1 occupancy peaks (Methods). Box plots depict the distributions of motif binding energies (Y-axis) in groups of regions with increasing Runx1 ChIP-seq coverage (binding level) (X-axis). The regions that passed the threshold and were thus defined as Runx1 bound are shown in dark blue boxes. The outliers represent values more than 90th percentile. (B) ETS binding motif is correlated with Runx1 ChIP-seq occupancy. An ETS motif was inferred directly from its association with Runx1 bound regions and analysis was conducted as in (A). The correspondence between Runx1 occupancy, GATA and AP-1 motifs binding energies was analyzed as in (A) and is presented in (C) and (D). Box plots depict the distributions of motif binding energies (Y-axis) in groups of regions with increasing Runx1 ChIP-seq readout coverage (X-axis).

