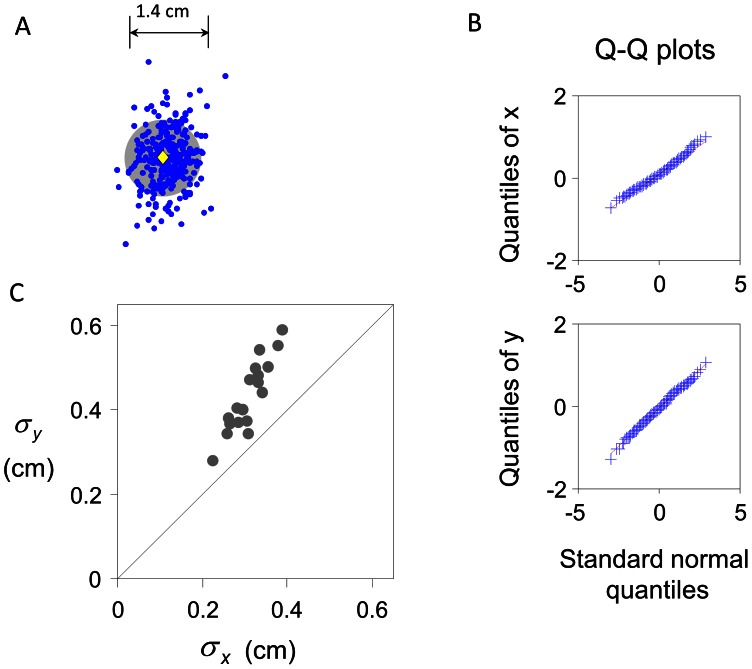
Figure 3. True error distribution in Experiment 1.
A. End points of one subject in the training task. Blue dots denote end points. The grey filled circle denotes the target. Yellow diamond marks the centroid of the target. The distribution of the errors is bivariate Gaussian, elongated in the vertical direction. B. Q-Q plots for the end points of the subject. The quantiles of the horizontal and vertical positions of the end points are plotted against the standard normal quantiles. The linear relationship in both directions implies that the distribution of the end points is bivariate Gaussian. C. The standard deviations of the end points in the horizontal ( ) and vertical (
 ) directions. Each point is for one subject. All subjects had a larger
  than
than  . That is, their distributions were vertically elongated. The median
  -to-
-to- ratio across subjects was 1.44.

