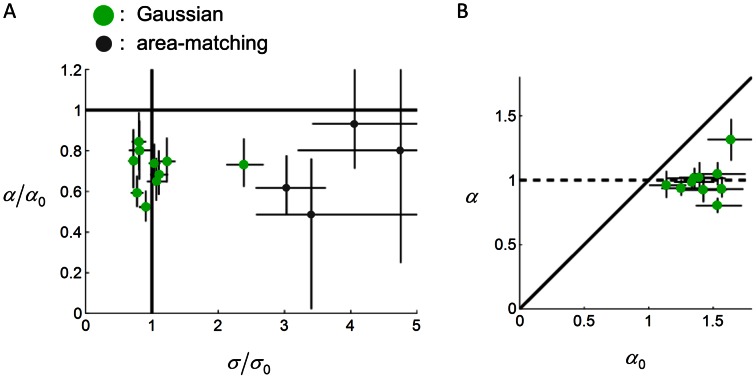
Figure 4. Subjects' models in probability choices in Experiment 1.
Each circle denotes one subject. Error bars denote 95% confidence intervals.  and
and  are the variance and anisotropy parameters of the true distribution
  (Eq. 3).
  and
and  are their counterparts in the subject's model
  (Eq. 4). A.
  plotted against
  . Among the 18 subjects, 10 subjects (the Gaussian type, in green) were better fit by the Gaussian model, who had internal variance close to true (
 close to 1) but who underestimated the vertical anisotropy of their true distribution (
 ). The remaining 8 subjects (the area-matching type, in gray) were better fit by the area-matching model, as if they were comparing the areas rather than the probabilities of hit of the targets. Four subjects of the area-matching type resulted in too large
  (13, 19, 57, 889) and were not plotted. b.
  plotted against
  for subjects of the Gaussian type. Note that
  was close to 1 regardless of the value of
  for most subjects. That is, the distribution was incorrectly assumed to be isotropic in subjects' model.

