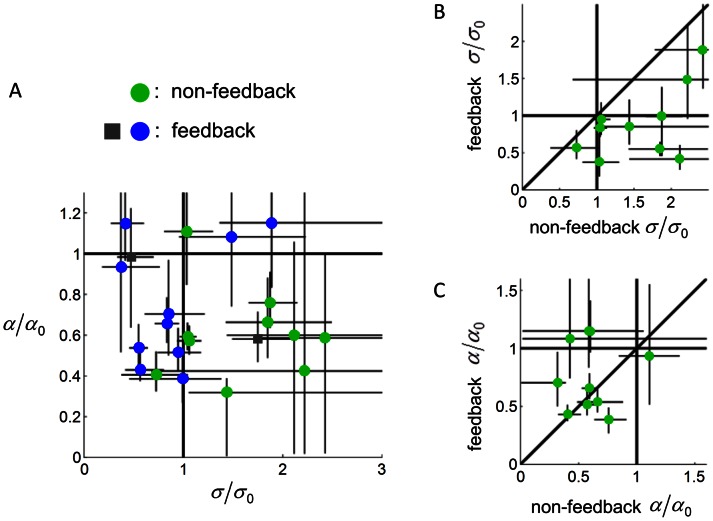
Figure 6. Subjects' model in Experiment 2.
A.  plotted against
  . Each circle or square denotes one subject. Green circles denote the non-feedback task (the two area-matching subjects, whose
  were 15 and 1210, were not plotted). Blue circles and gray squares respectively denote the performances in the feedback task for subjects who belonged to the Gaussian type and the area-matching type in the preceding non-feedback task. B.
  in the feedback task against
  in the non-feedback task. C.
  in the feedback task against
  in the non-feedback task. Error bars denote 95% confidence intervals.

