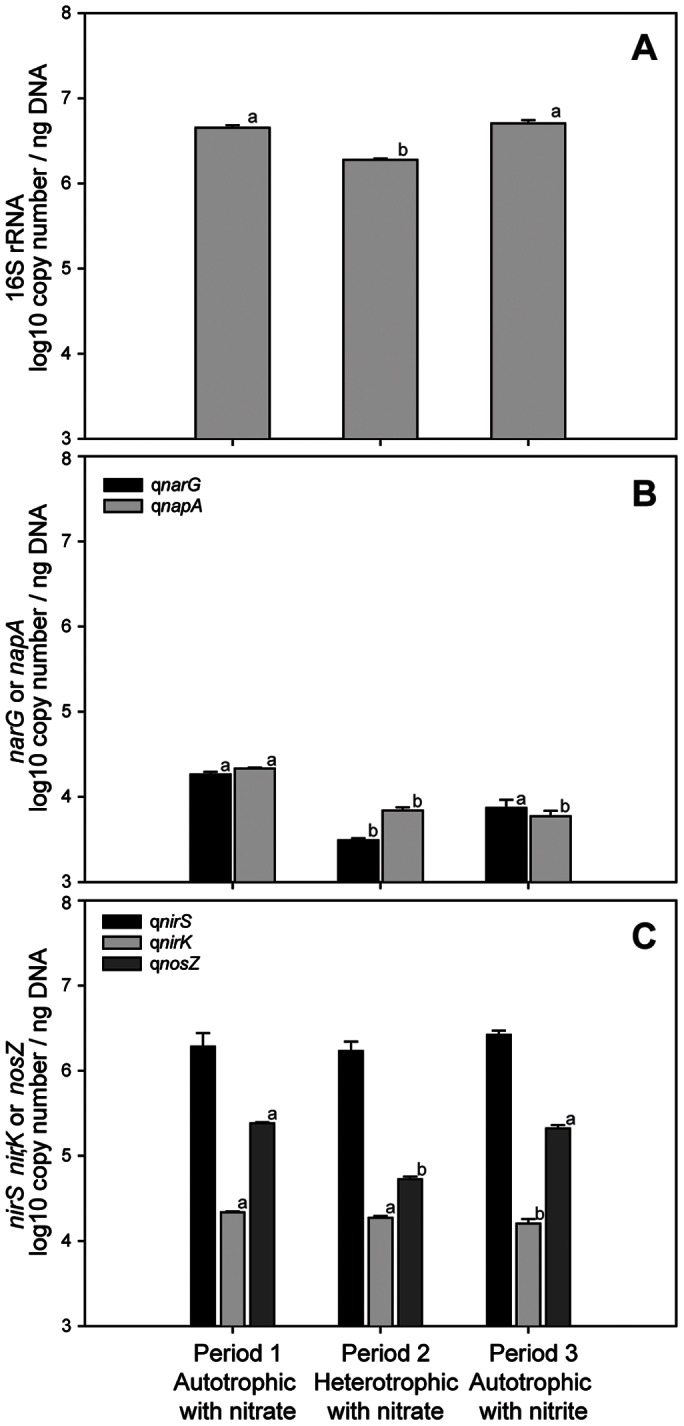
Figure 1. Abundances of the 16S rRNA and functional genes for the three periods studied.

Mean values of the number of copies of the bacterial 16S rRNA (A) and the functional genes, narG and napA (B), nirS, nirK and nosZ (C) were represented according to the feeding periods in the cathode of a MFC. Standard errors of the mean are indicated. Different letters above the bars indicate significant differences (p<0.05) between periods.
