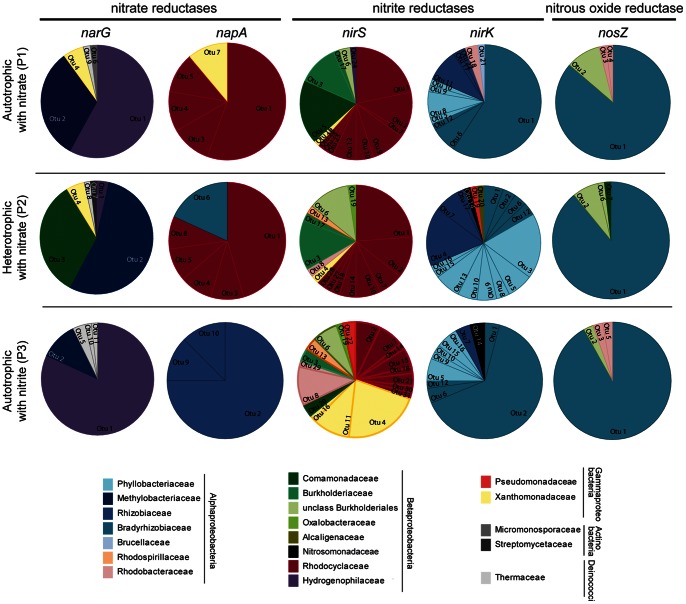
Figure 2. Composition of denitrifier communities.
Pie charts comparing the community composition of denitrifiers according to functional gene similarities. Five denitrification genes, narG, napA, nirS, nirK and nosZ, at three different feeding periods in the cathode of a MFC are indicated. To facilitate the comparison between OTU distributions of bacterial communities, colors have been used as an indication of bacterial families and orders. Assignations have been made according to sequence similarities and may not reflect the exact phylogeny of the bacteria present.

