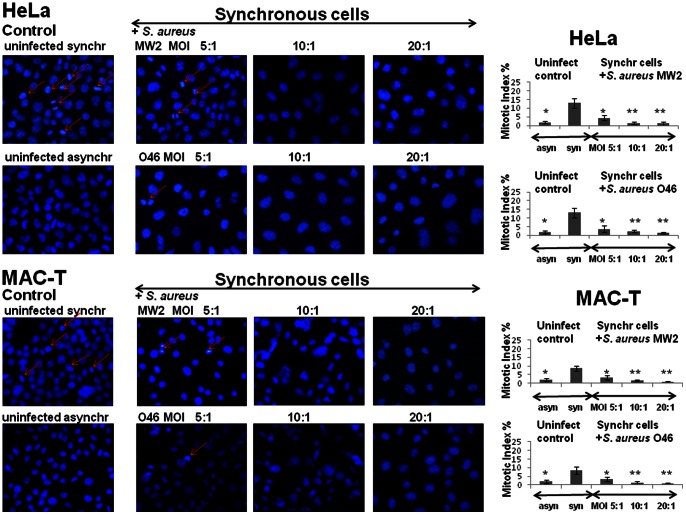
Figure 4. Substantial drop in the mitotic index in S. aureus-infected cells.
HeLa or MAC-T cells were synchronized by DTB and were then exposed to MW2 or O46 strains at MOIs ranging from 5∶1 to 20∶1 for 2 h, followed by incubation in cDMEM-Gent100 for 2 h, and further incubated for 25 h. After centrifugation, the cells were fixed and stained with DAPI. Red arrows indicate the mitotic cells. The mitotic indexes in infected and in uninfected synchronous cells were evaluated by microscopic observation using ×400 magnification. Data are presented as mean +/− SD. The differences among the groups were assessed by ANOVA. (*) P-values <0.05 and (**) P-values <0.01 compared with the control were considered to be significant. Tukey's Honestly Significant Difference test was applied for comparison of means between the groups.

