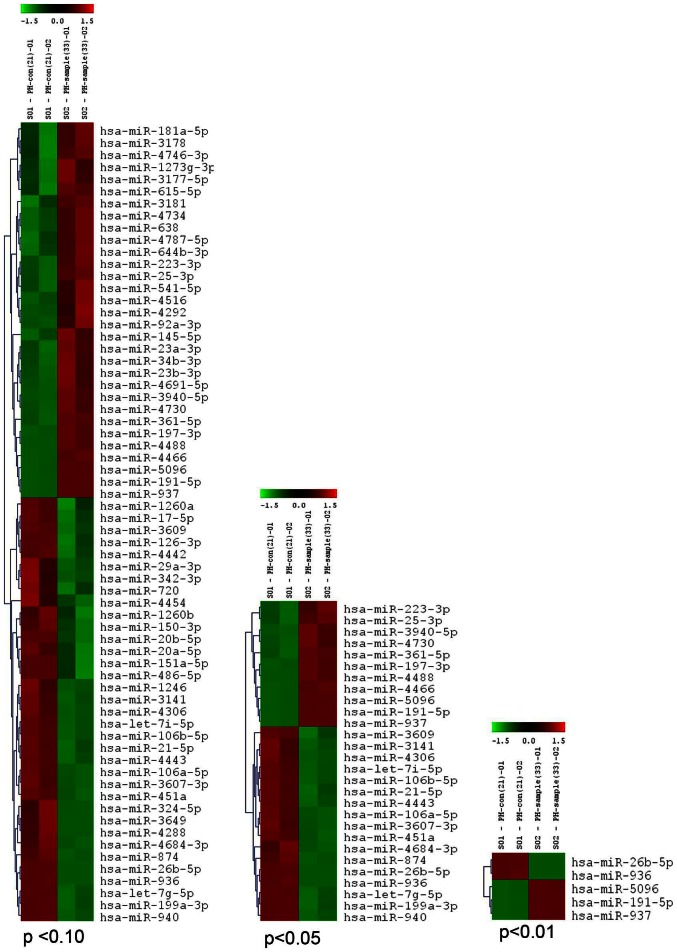
Figure 2. Heat map showing the expression of dysregulated miRNAs in control and PH human subjects.
MiRNA microarray data was prepared using data from the miRNA microarray performed using samples from PH human patients and compared with healthy controls. The signal difference (log2) is plotted versus the level of statistical significance (−log10 p-value). Color and spot diameter depicted information about mean expression level and percent detected, respectively, in static plots.

