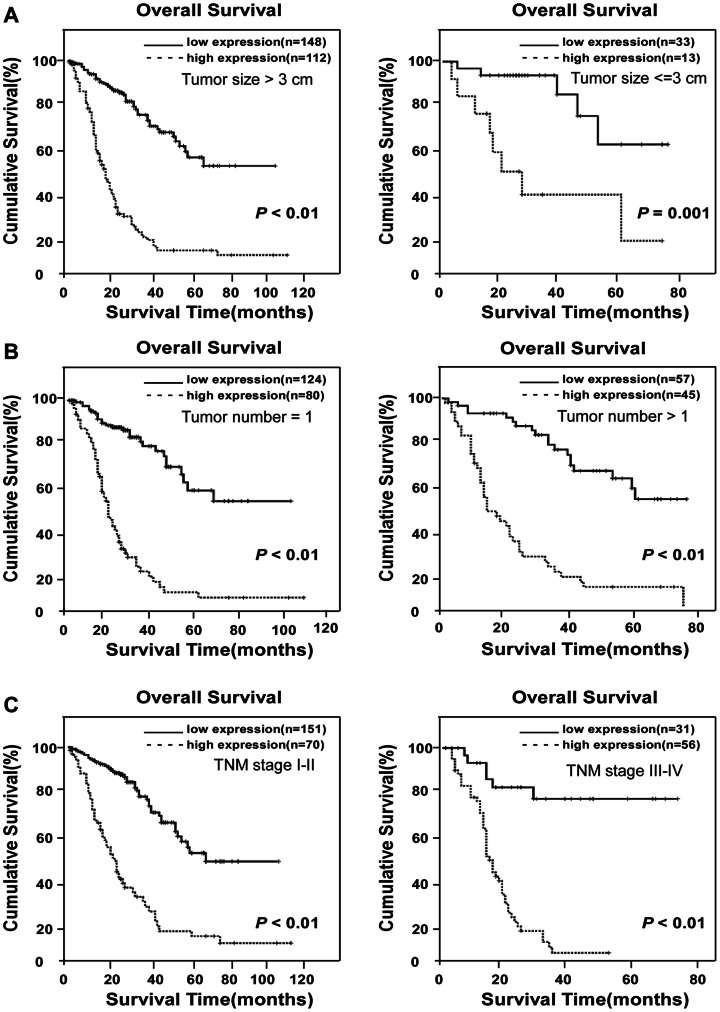
Figure 4. Kaplan-Meier analysis of OS in 308 patients based on MACC1 expressions in HCC clinical subgroups.
(A) Statistical significance of the difference between curves of MACC1 high-expressing and low-expressing patients was compared in large HCC lesion (diameter >3 cm, left panel) and small HCC lesion (diameter ≤3 cm, right panel) patient subgroups. (B) OS in patients with single tumor lesion and multi-tumor lesion. (C) OS rates in patients subgrouped into TNM stages I-II (left) and TNM stages III-IV (right) as differentiated by high- or low-MACC1 expression.

