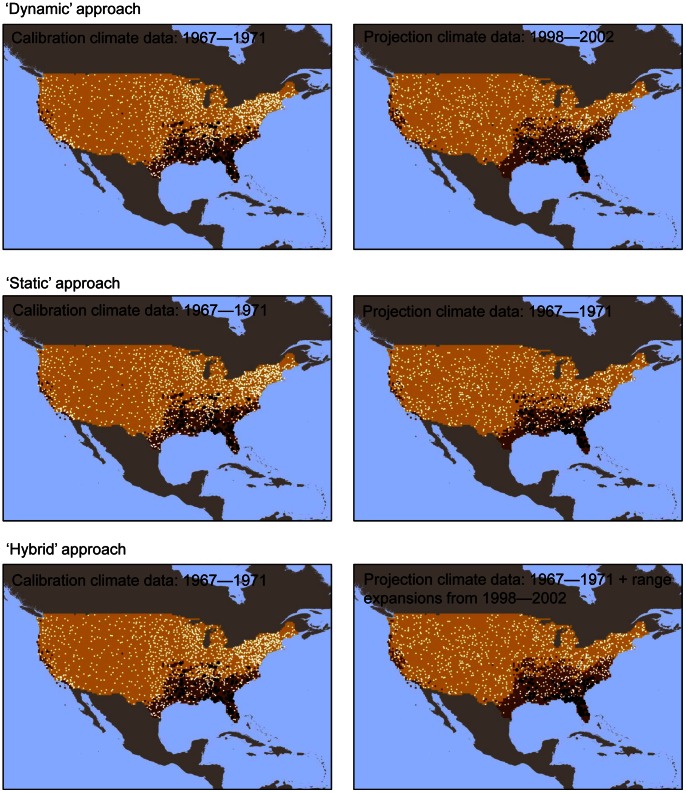
Figure 1. Examples of the three approaches to construction and validation of climate envelope models.
All models are calibrated with occurrence data and climate conditions from 1967–1971 (left-hand panels), and validated with occurrence data from 1998–2002 (right hand panels). Black circles indicate species presence and white dotes indicate species absence. The prediction map against which occurrences are validated using the dynamic approach represent the climate envelope under 1998–2002 conditions and for the static approach the prediction map represents the 1967–1971 climate envelope. Under the hybrid approach, areas of range expansion between 1967–1971 and 1998–2002 are merged with the 1967–1971 climate envelope to create a third prediction map.

