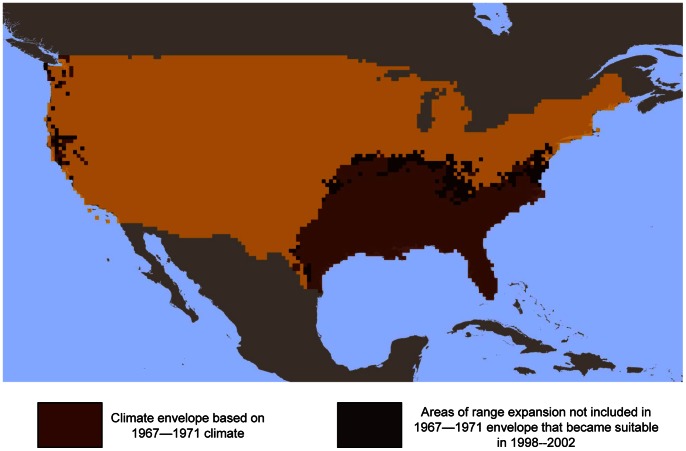
Figure 2. Example map illustrating a ‘hybrid’ approach to climate envelope model construction.
Areas indicated in black are included in the 1998–2002 projection, but were not part of the initial climate envelope. These areas range expansion between 1967–1971 and 1998–2002 are merged with the initial 1967–1971 climate envelope to create a hybrid prediction map.

