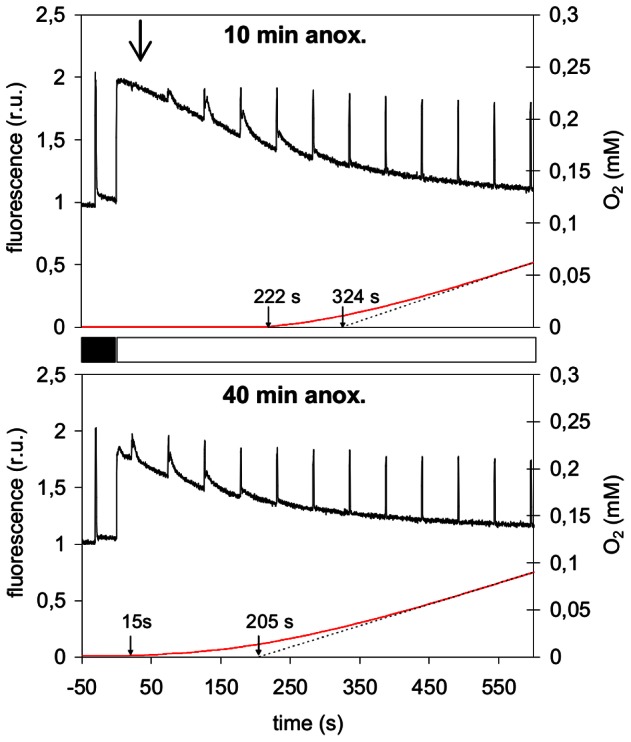
Figure 4. Photosynthesis activation following anoxic incubation in a state transition disabled mutant.

Chla fluorescence (black) and O2 evolution (red) traces upon illumination (250 µmol.m−2.s−1) of stt7, a mutant locked in state 1, following either a 10 min (upper graph) or 40 min (lower graph) anoxic incubation in the dark . Saturating light flashes (1 s flashes of 3000 µmol.m−2.s−1 every 50 s) were applied during the induction process in order to saturate transiently all PSII reaction centers and determine the maximal fluorescence yield Fm′ in the light. Arrows on the time axis indicate the start of detectable oxygen evolution and the intercept of the dashed line drawn from the steady-state O2 evolution trace with the time axis. The large arrow in the upper graph marks the moment of the first saturating light flash.
