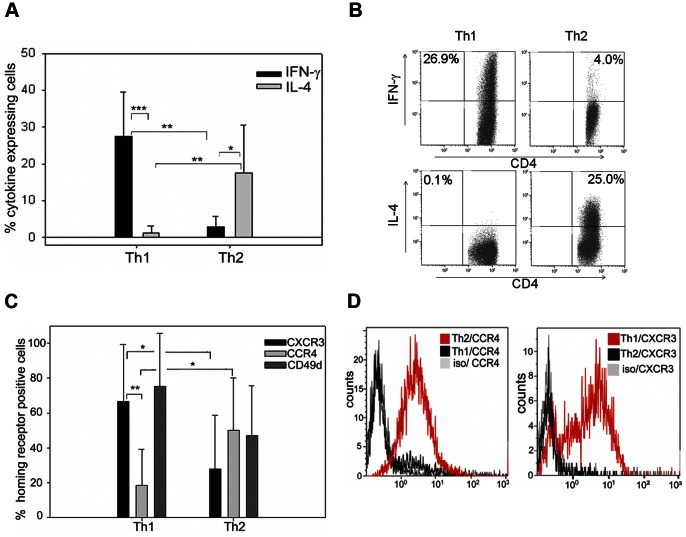
Figure 1. Distinct phenotypes of CD4 T cells activated under Th1 and Th2 polarising conditions.
(A) Intracellular staining of polarised T cells for IFN-γ and IL-4. Bars indicate percentage cytokine expressing CD4 gated T cells after flow cytometric analysis, error bars represent SD. *P<0.05, **P<0.01, ***P<0.001, t-test, n = 8. (B) Illustrative intracellular staining for IFN-γ and IL-4 (quadrants set according to isotype control) from Th1 and Th2 polarised T cells. (C) Surface staining and flow cytometry analysis of cell surface receptors implicated in lymphocyte homing; pooled data for expression of chemokine receptors CXCR3, CCR4, and CD49d. Bars indicate percentage homing receptor expressing CD4 gated T cells after flow cytometric analysis, error bars represent SD. *P<0.05, **P<0.01, t-test, n = 8. (D) Representative staining of chemokine receptors CCR4 and CXCR3 on Th2 and Th1 polarised T cells.

