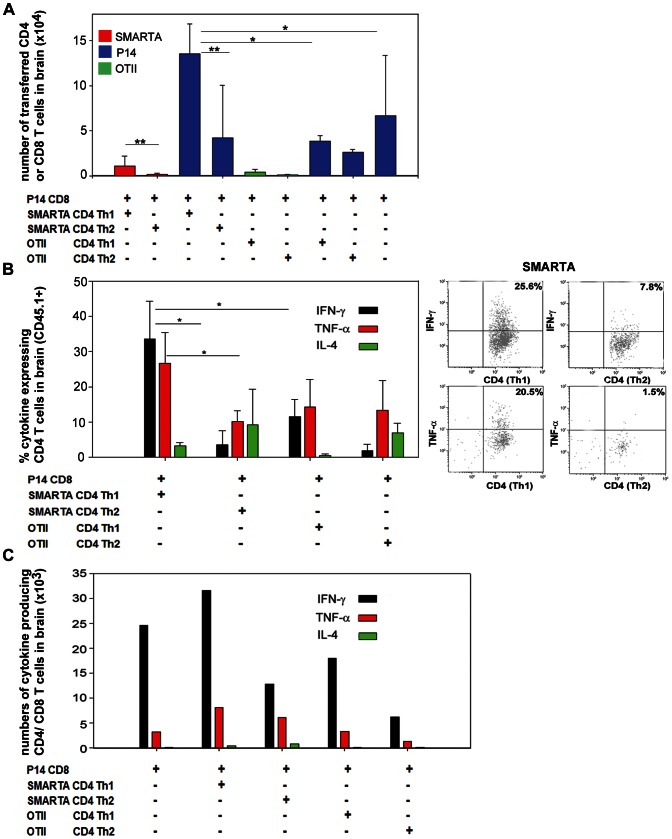
Figure 3. Enhanced recruitment of cytokine expressing T cells to the brain tumour site by co-transfer of tumour-antigen specific CD4 Th1 T cells.
Th1 or Th2 polarised T cells from SMARTA and OTII mice were labelled with CFSE. Naïve (non-cultured) P14 CD8 T cells were labelled with Violet dye. The different T cell populations were intravenously transferred into C57BL/6 mice (CD45.2) that had been previously intracranially implanted with 4×10⁵ MC57-GP tumour cells. P14 CD8 T cells were transferred 1 day after tumour implantation; SMARTA and OTII CD4 T cells were transferred the next day, in the combinations indicated. The numbers of cells transferred were 3×10⁶ Th1, 3×10⁶ Th2, and 6×10⁶ P14. At day 6 after tumour implantation, BILs were isolated and analysed ex vivo by multicolour flow cytometry. Adoptively transferred T cells were identified as CD45.1+CD4+CFSE+ cells or CD45.1+CD8+ Violet dye+ cells. Each group of mice comprised 3–5 animals, and results from several experiments were pooled to acquire data from 12 mice. (A) Absolute numbers of each population of adoptively transferred T cells per brain. Results are displayed as means+SD. *P<0.05; **P<0.01: Mann-Whitney Rank sum test. (B) Left panel: intracellular staining of BILs gated on CD45.1+CD4+CFSE+ cells. Expression of IFN-γ, IL-4 and TNF-α is shown after ex vivo restimulation with cognate peptides. Results are displayed as means+SD. *P<0.05: t-test. Right panel: representative dot plots of ex vivo restimulated SMARTA CD4 T cells. (C) Total numbers of cytokine expressing adoptively transferred T cells per brain (including both CD4 and CD8 T cells). Results are displayed as means of 3 pools of mice, from 12 mice in total.

