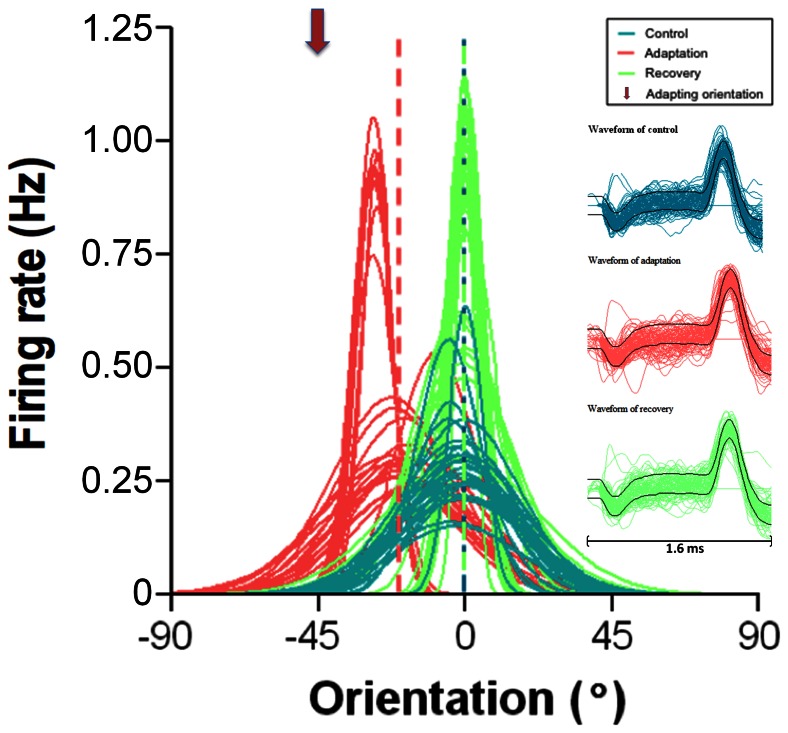
Figure 1. Typical example of an attractive shift.
Twenty-five presentations of each orientation. Gaussian fits and orientation are normalized in this and other figures: optimal orientation is marked zero. Vertical broken lines indicate optimal orientations. Downward arrowhead indicates adapting orientation in this and all figures. Horizontal Right inserts show spike waveforms recorded during each phase of the recordings. Bar equals 1.6 ms.

