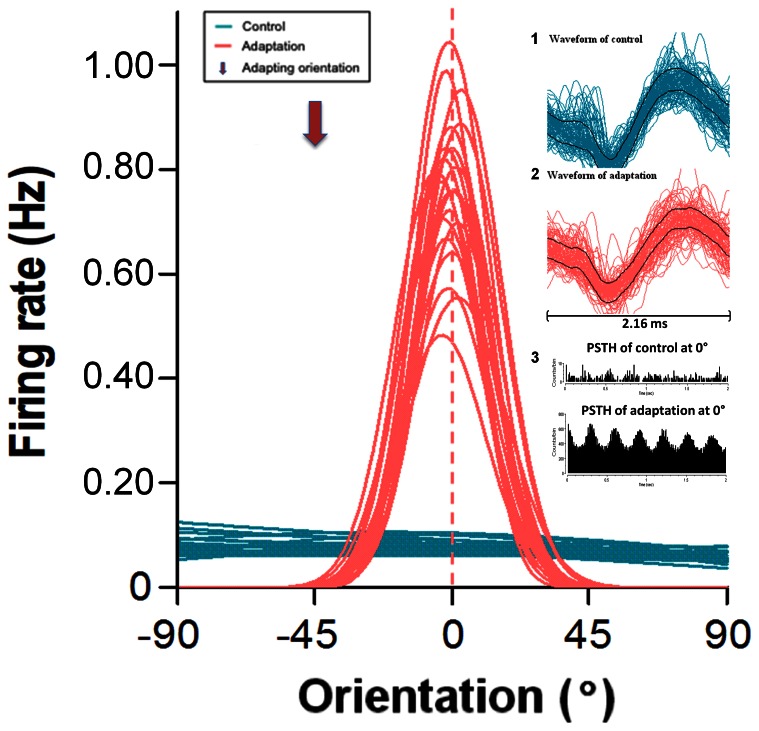
Figure 4. Example of a neuron untuned to orientation.
Prior to adaptation (in blue) no orientation evokes a stronger response. Following adaptation (in red) a clear optimal orientation emerges. Right inserts, tracing 1 and 2 show spike waveforms recorded during each phase of the recordings, bar equals 2.16 ms. Tracings in 3 illustrates PSTHs of evoked responses prior to (upper) and following (lower) adaptation respectively.

