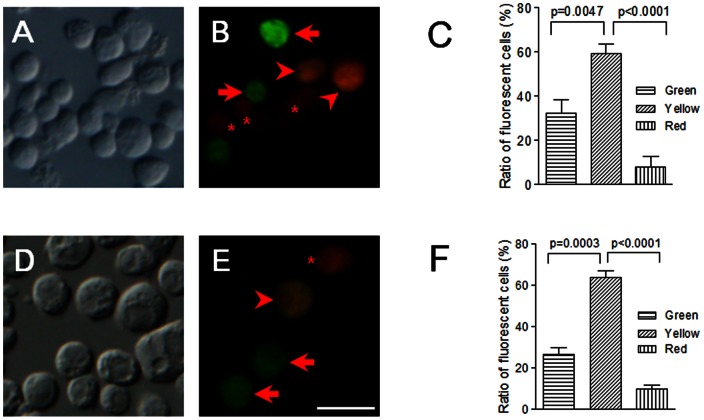
Figure 4. Co-expression of rPPO2-DsRed with either rPPO1-GFP or rPPO3-GFP.
Plasmids containing rPPO1-GFP and rPPO2-DsRed (A-B) or rPPO3-GFP and rPPO2-DsRed (D-E) were co-transfected into S2 cells in the absence of Cu2+. Cells with green fluorescence (arrows) expressed rPPO1-GFP or rPPO3-GFP, and cells with red fluorescence (asterisks) expressed rPPO2-DsRed. Cells with yellow fluorescence (arrowheads) co-expressed rPPO2-DsRed and either rPPO1-GFP (B) or rPPO3-GFP (E). All images were taken using green and red filters, and were then merged. (C-F) Among PPO positively stained S2 cells, over 60% had yellow fluorescence, approximately 25% had green fluorescence, and less than 10% had red fluorescence (C, F). Obviously, the ratio of cells with yellow fluorescence is significantly higher than that with red or green fluorescence but not all cells were expressing multiple rPPOs at the same time. Columns represent the mean of individual measurements ± S.E.M (n = 4). Significant differences were calculated using the unpaired t test program. Bar: 20 µm.

