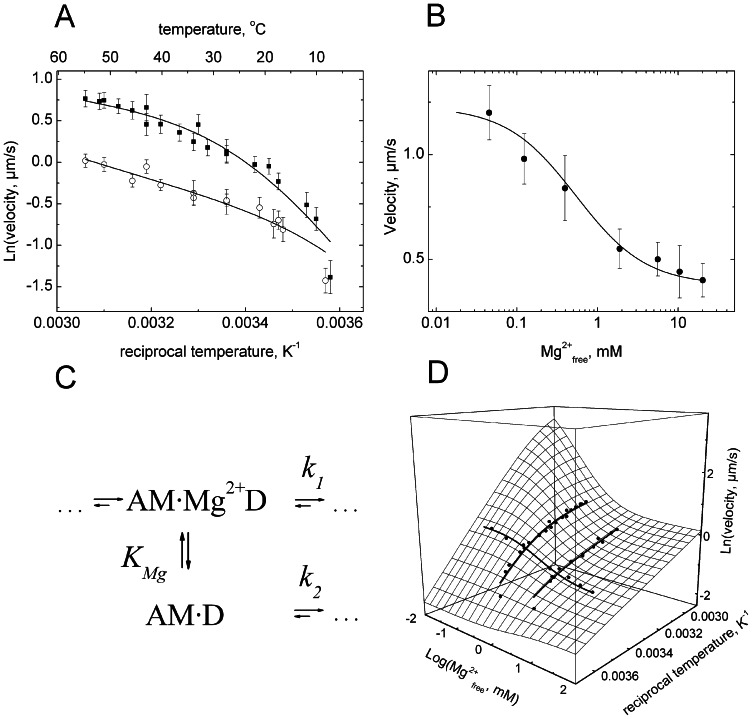
Figure 1. Dependence of myosin-5b sliding velocity on reciprocal Kelvin temperature (A) and free Mg2+ ion concentration (B).
The data in panel A show sliding velocities at two limiting Mg2+ ion concentrations of 4.5 mM (open circles) and 0.05 mM (solid squares) over a range of 50°C. Error bars represent the mean value of half bandwidths of Gaussian distributions of sliding velocities obtained from statistical analysis of motility time lapse images averaged over 3 to 5 independent experiments for each temperature point. Panel B shows sliding velocities obtained at 20°C as a function of free Mg2+-ion concentration. All three data sets were simultaneously fitted using equation 1. Solid lines are the results of the global fit. Thermodynamic parameters of the fits are given in table 1. (C) Kinetic model of the two alternative ADP dissociation steps in the acto-myosin-5b cycle. A is F-actin, M is Dictyostelium myosin-5b, Mg2+ is the divalent magnesium cation, D is ADP. The top pathway represents the simultaneous dissociation of Mg2+ADP and the bottom pathway ADP dissociation from acto-myosin. The two states AM·Mg2+D and AMD are in fast equilibrium defined by the dissociation constant K Mg, which is temperature dependent. (D) Three dimensional surface plot of myosin-5b sliding velocity dependence on temperature and free Mg2+-ions calculated from equation 1 using parameters shown in table 1. Experimental points from A and B are included as filled circles.

