
Figure 4. Competitive index (CI) analysis of WT and Δsrr1 mutant obtained in the rat model of endocarditis.
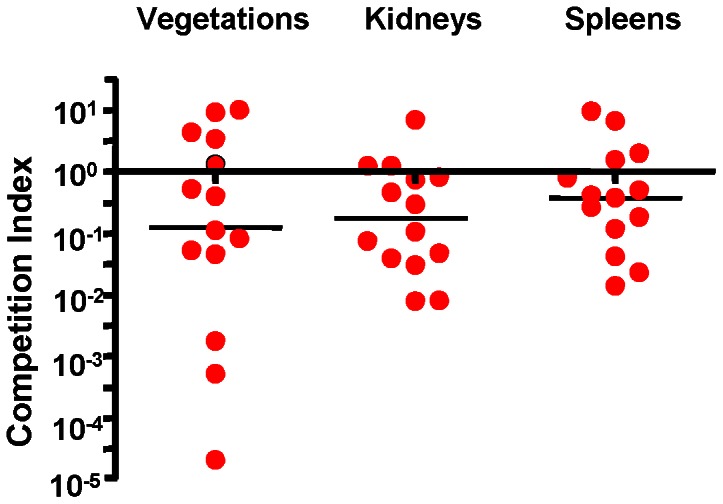
Competition index (CI) was calculated as the ratio of the WT to the Δsrr1 mutant in each tissue, normalized for the ratio of strains within the inoculum. Circles represent data from individual animals. A CI above 100 (dashed line) indicates a competitive disadvantage of Δsrr1 compared with WT. Horizontal black bars indicates means of CIs.