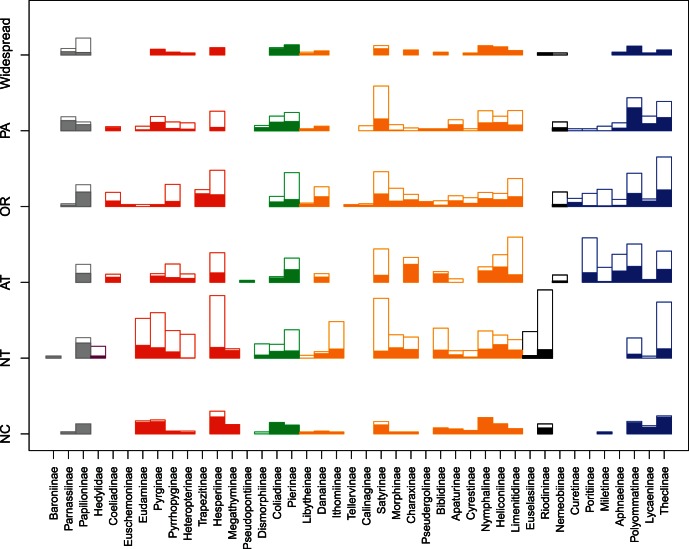
Figure 2. Geographical and taxonomical representativeness of host plant association data.
Block height is proportional to the square root of the number of butterfly species among regions and subfamilies. Solid blocks represent the number of species with host plant records. Open blocks represent the number of species without host plant records. Grey: Papilionidae. Dark red: Heylidae. Red: Hesperiidae. Green: Pieridae. Orange: Nymphalidae. Blue: Lycaenidae. Black: Riodinidae.

