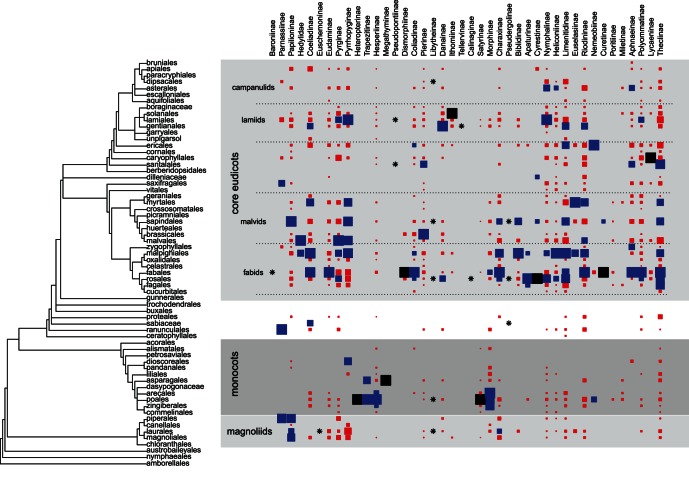
Figure 3. Graphical representation of the butterfly host plant association matrix.
The squares represent the proportion of butterfly species in each subfamily that feed on a plant order (zij). Only important resources are shown, colors denote values between 0.1< zij ≤0.5 (red), 0.5< zij ≤0.9 (blue), and zij>0.9 (black). The stars (*) denoted subfamilies with 15 or less species.

