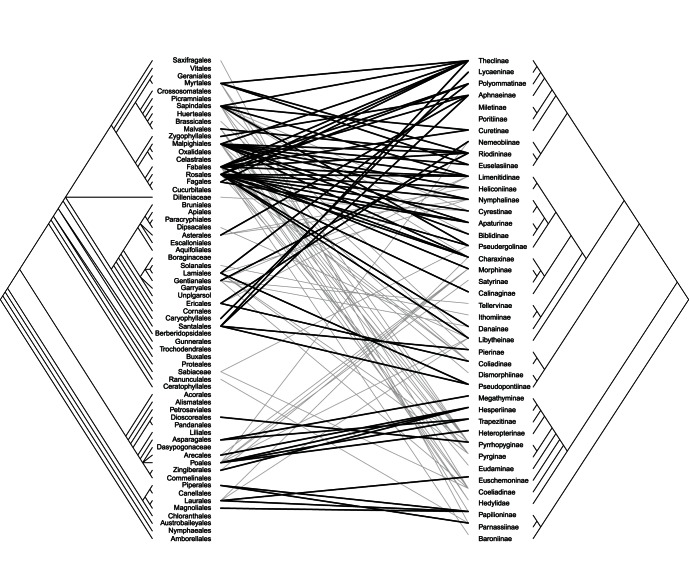
Figure 4. Congruence among plant (right) and butterfly (left) phylogenies.
Lines between the phylogenies indicate associations based on the interaction matrix of important links (X), black lines represent congruent links (p<0.05) according to the ParaFitLink2 test. Based on the alternative 1 cladogram.

