
Figure 2. The CTD forms transient oligomers in solution.
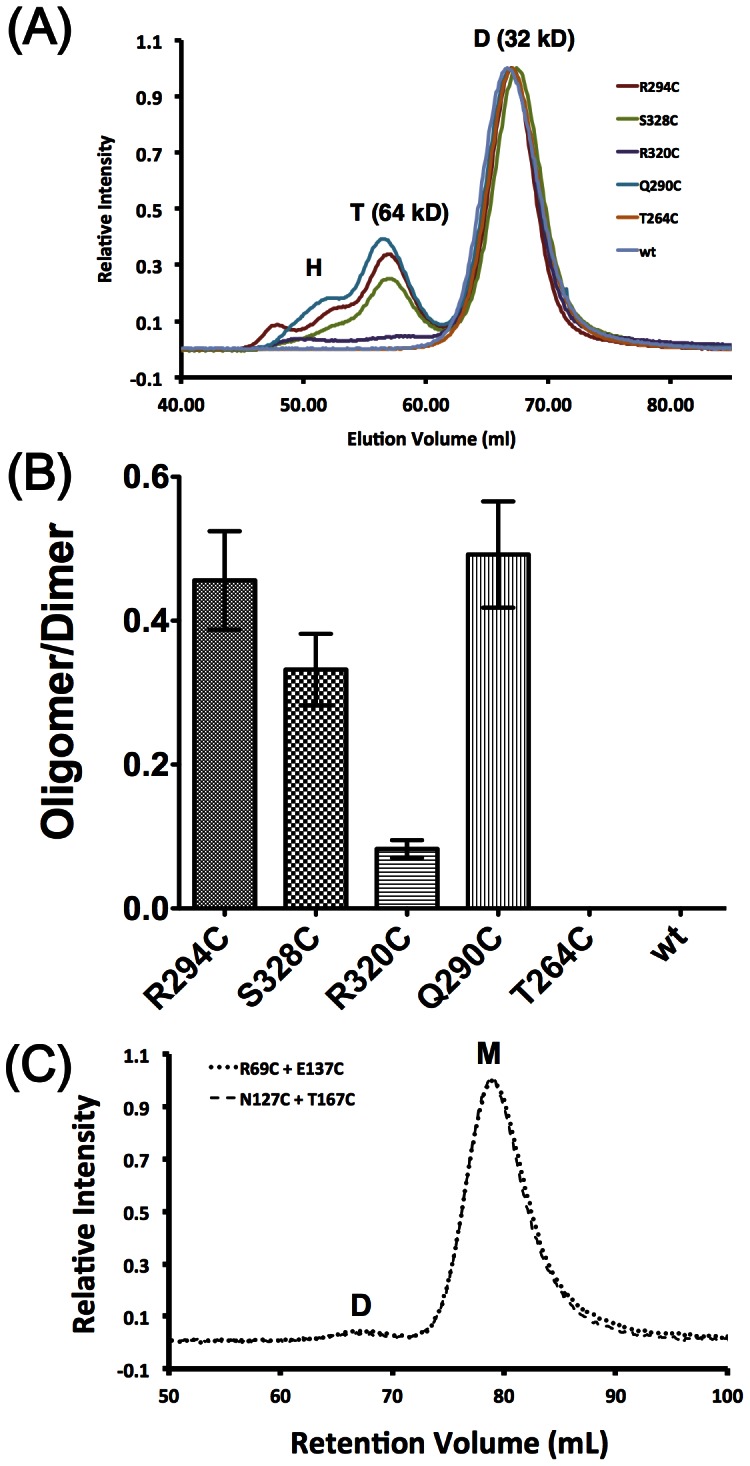
(A) Chromatograms of wild-type (wt) and mutant CTDs after disulfide trapping show that some CTD mutants are forming oligomers while others are not, as evidenced by the appearance of peaks H (for high-order oligomer) and T (tetramer). Relative intensities were normalized to the major peak representing dimeric CTD (peak D). (B) Bar representation of the oligomer/dimer ratios of the CTD mutants estimated by area integration of chromatogram profiles shown in (A). The amount of oligomer is the sum of tetramer and higher oligomers. Error bars represent fitting errors calculated from the residual between fitted and experimental elution profiles. Wild-type and the T264C mutant showed negligible oligomer formation. (C) SEC profiles of NTD mutants after disulfide trapping treatment. Each reaction contained 3 mg/ml of total protein with each mutant comprising half of the concentration. Reaction conditions were the same as those used for the CTD mutants. Only very little dimer (D) formation was observed for both NTD mutation pairs with most of the protein remaining in the monomer (M) form.