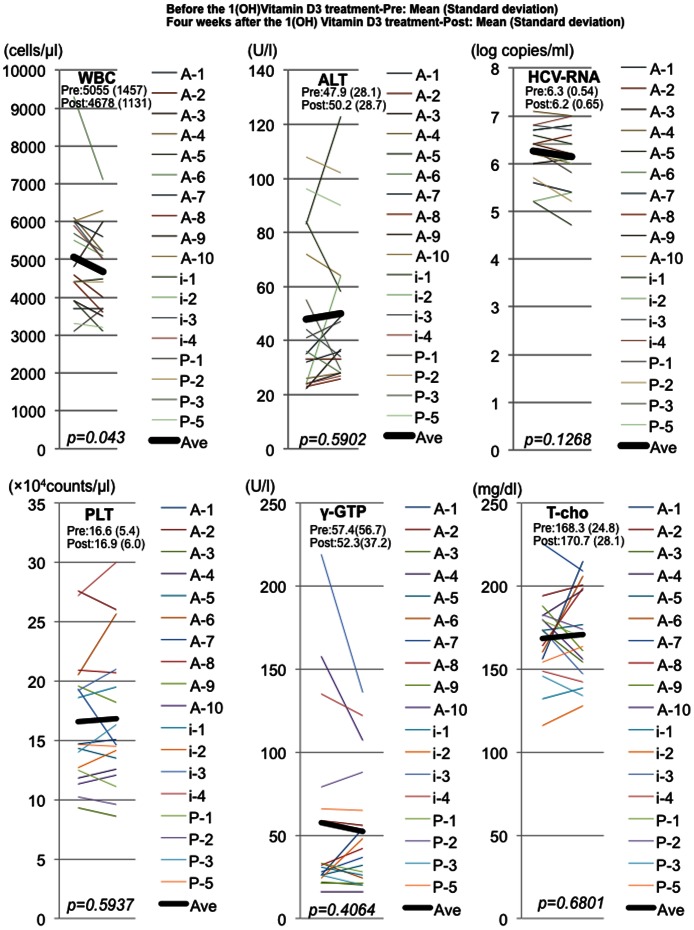
Figure 3. Comparison of hematological and biochemical analysis between before and after 4-week 1(OH) vitamin D3 treatment.
Representative hematological, biochemical and virological data are shown. WBC indicates white blood cell count. ALT indicates alanine transaminase. HCV-RNA indicates titer of hepatits C virus RNA. PLT indicates platelet count. γ-GTP indicates gamma-glutamyl traspeptidase. T-cho indicates total cholesterol. The data at pre- and post-4weeks administration of 1(OH) vitamin D3 without Peg-IFN/RBV are shown. Black lines indicate the average of each analysis.

