
Figure 5. Comparison of Th1 and Tregs between 1(OH) vitamin D3/Peg-IFN/RBV and Peg-IFN/RBV.
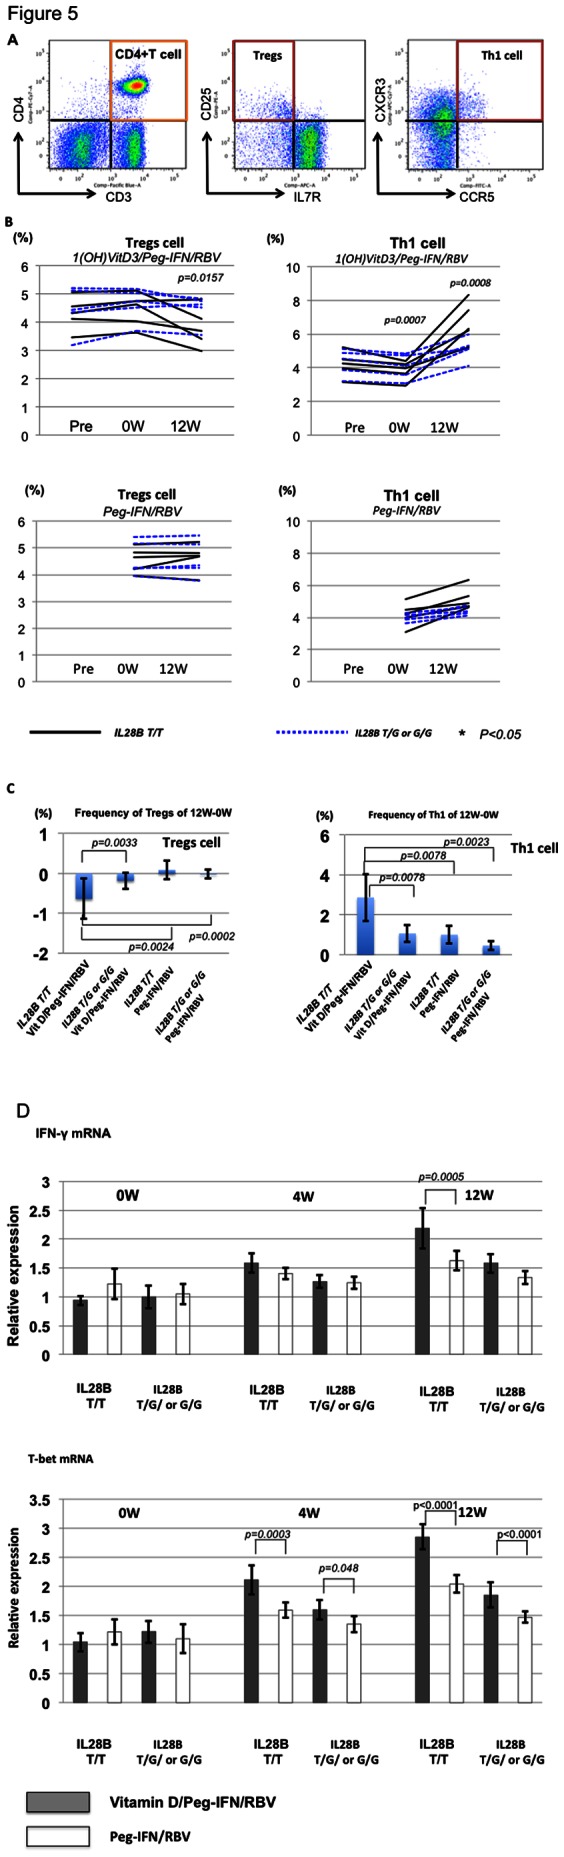
Representative dot plots of CD3+CD4+CD25+IL7R− (Tregs) and CD3+CD4+CXCR3+CCR5+ (Th1 cells) are shown. (A) Frequencies of Th1 and Tregs among the 4 groups (IL28B T/T vitamin D3/Peg-IFN/RBV, IL28B T/G or G/G vitamin D3/Peg-IFN/RBV, IL28B T/T Peg-IFN/RBV, and IL28B T/G or G/G Peg-IFN/RBV) are shown. (B) Comparison of the T-bet and IFN-γ mRNA expression between subjects treated with vitamin D3/Peg-IFN/RBV therapy and those treated with Peg-IFN/RBV therapy. Each group included 5 patients. Total mRNA was extracted from isolated CD4+ T cells. The relative expression levels are shown in bar graphs. The statistical analysis was carried out by independent student t-test.