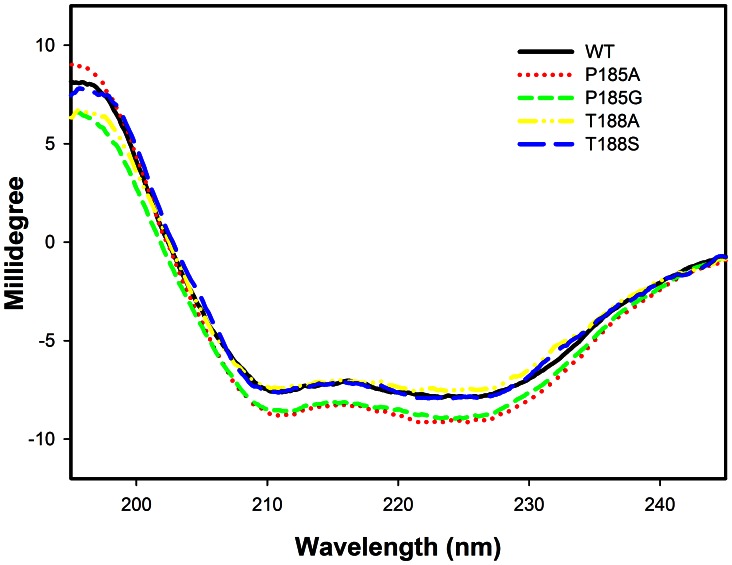
Figure 3. CD spectra of wild-type 3α-HSD/CR and mutant enzymes.
The CD spectra of wild-type and the P185A, P185G, T188A and T188S mutant enzymes. The mutation at P185 causes an increase in the intensity at 222 nm, compared to that of the wild-type enzyme. The CD spectra were measured at 8.8 µM enzyme in 10 mM phosphate at pH 7.5 at room temperature.

