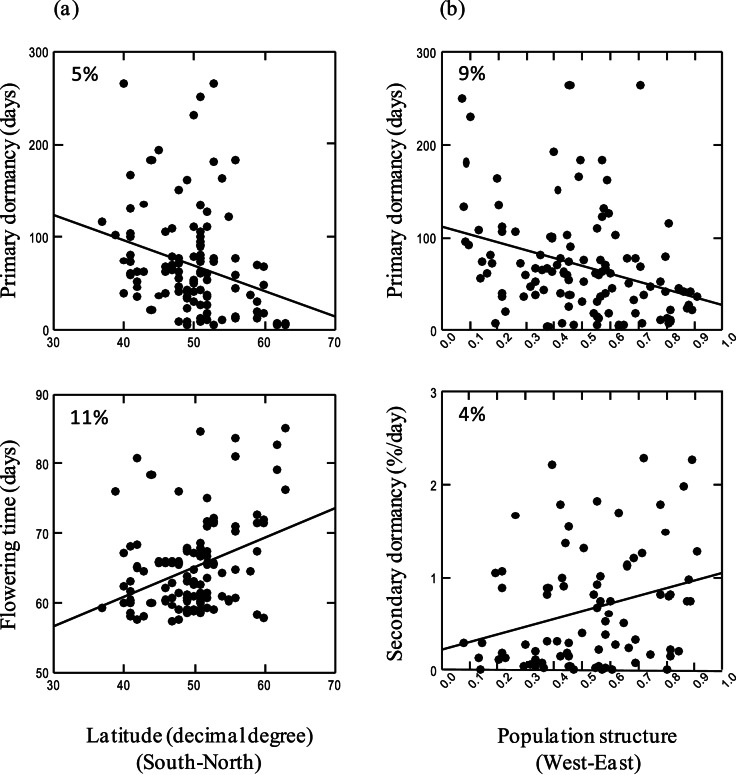
Figure 4. Life history traits as a function of the gradients in latitude (expressed in °North) and/or population structure (measured as the relative contribution to the first population structure group).
Only significant effects reported in Table 2 are shown with the percentage of variance explained associated. (a) Latitude has a significant effect on primary dormancy and flowering time, p<0.05 and p<0.001, respectively. (b) Population structure estimated by the probability to belong to one of the two clusters, has a significant effect on primary and secondary dormancy, p<0.01 and p<0.1, respectively.

