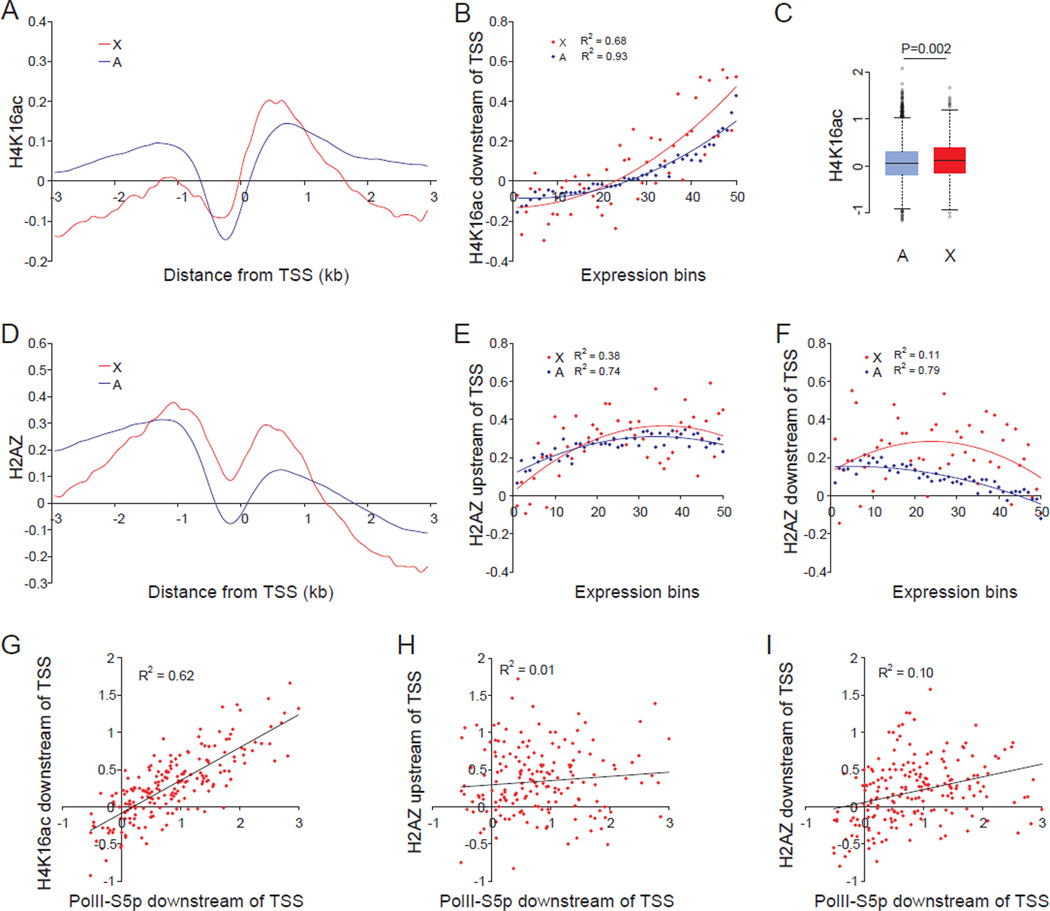
Figure 3. Higher levels of H4K16ac and H2AZ at the 5’ end of expressed X-linked versus autosomal genes in female ES cells.
(A–I) ChIP-chip analyses using promoter arrays in undifferentiated female ES cells PGK12.1. Regression values (R2) are shown where appropriate.
(A) Metagene analysis of H4K16ac at the promoter-proximal region of expressed X-linked (X) and autosomal (A) genes. Average enrichment (log2 ChIP/input) was plotted 3kb up- and downstream of the TSS for 387 X-linked and 9800 autosomal expressed genes (≥1RPKM).
(B) Average binding scores of H4K16ac in a 1kb region downstream of the TSS plotted for 50 expression-ranked bins, each containing 10 X-linked and 255 autosomal genes. A total of 506 X-linked and 12755 autosomal genes (>0RPKM) were examined.
(C) Box plots of promoter-binding scores of H4K16ac on expressed X-linked and autosomal genes (≥1RPKM). P value from Wilcoxon-test is shown.
(D) Metagene analysis of H2AZ at the 5’ end of expressed X-linked and autosomal genes. Same analysis as in (A).
(E–F) Average binding scores of H2AZ in a 0.5–1.5kb region upstream of the TSS (E) and a 1kb region downstream of the TSS (F). Same analysis as in (B).
(G–I) PolII-S5p promoter-proximal occupancy at expressed X-linked genes is well correlated with H4K16ac promoter enrichment (G) but not with H2AZ (H–I).
See also Figures S3 and S4.

