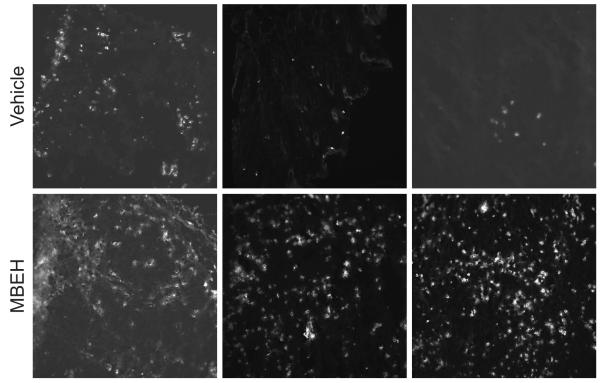
Fig9. Cytokine profiling in the tumor environment.
Transcript levels of pro and anti-inflamatory cytokines evaluated by qRT-PCR in mice tumor samples. Relative fold change in the expression levels are shown upon normalization with vehicle treatment. Mean and standard deviation were calculated from 3 replicates. Experiments were repeated thrice and data from a representative experiment are shown.

